Here, we'll build a simple live stock monitor using the real-time line chart to monitor the price of a stock (say Google). To create any real-time chart, you'll need to assimilate the following things:
- Chart SWF file and FusionCharts JavaScript Class
- XML/JSON file that initializes the chart and tells it where to pull the real-time data from
- Real time data provider page that provides updated data to chart in real-time data format
For this example, we've created a folder named RealTime. The samples discussed here is present in Download Package > Code > RealTime folder.
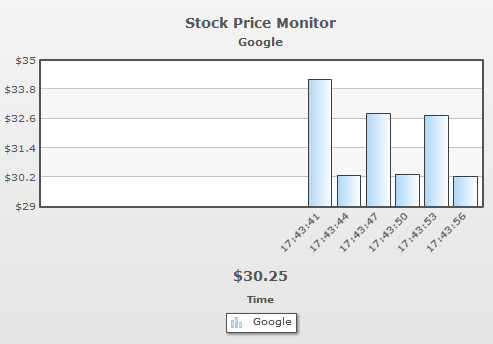
As you can see above, here we're monitoring the stock price of Google in a real-time line chart. We've:
- Initialized the chart with no data
- Configure the chart to attain right visual look
- Set it to update itself in real-time from our own data provider page. The chart updates itself every 3 seconds.
- Our data provider page provides a value between 30 and 35 for demo. We've just generated random numbers between 30 and 35 for this example. In real life, you can drive it from web services or databases.
- The data provider page also provides the x-axis labels for the chart, which is in the format hh:mm:ss.
<chart caption="Stock Price Monitor" subCaption="Google" dataStreamURL="StockPrice.asp" refreshInterval="3" numberPrefix="$" setAdaptiveYMin="1" xAxisName="Time" showRealTimeValue="1" labelDisplay="Rotate" slantLabels="1">
  <categories/>
  <dataset seriesName="Google" showValues="0"/>
  <styles>
    <definition>
      <style type="font" name="captionFont" size="14"/>
    </definition>
    <application>
      <apply toObject="Realtimevalue" styles="captionFont"/>
    </application>
  </styles>
</chart>
{
  "chart": {
    "caption": "Stock Price Monitor",
    "subcaption": "Google",
    "datastreamurl": "StockPrice.asp",
    "refreshinterval": "3",
    "numberprefix": "$",
    "setadaptiveymin": "1",
    "xaxisname": "Time",
    "showrealtimevalue": "1",
    "labeldisplay": "Rotate",
    "slantlabels": "1"
  },
  "categories": [
    {}
  ],
  "dataset": [
    {
      "seriesname": "Google",
      "showvalues": "0"
    }
  ],
  "styles": {
    "definition": [
      {
        "type": "font",
        "name": "captionFont",
        "size": "14"
      }
    ],
    "application": [
      {
        "toobject": "Realtimevalue",
        "styles": "captionFont"
      }
    ]
  }
}
Here, we've first:
- Defined the caption, sub-caption and other labels of the chart using caption and subCaption attributes.
- Set number prefix as $, as we'll be plotting stock prices using numberPrefix attribute.
- We've set the dataStreamURL of the chart as StockPrice.asp and refresh interval as 3 seconds using the refreshInterval attribute. This means that the chart will poll StockPrice.asp every 3 seconds to fetch new data and thereafter update itself.
- We've set the chart to show the real-time value using the showRealTimeValue and attribute.
- Since we do not intend to show any historical data in this chart, we just provide empty <categories> and <dataset> element. However, we have, set the seriesName of <dataset> element as Google - this will appear in legend.
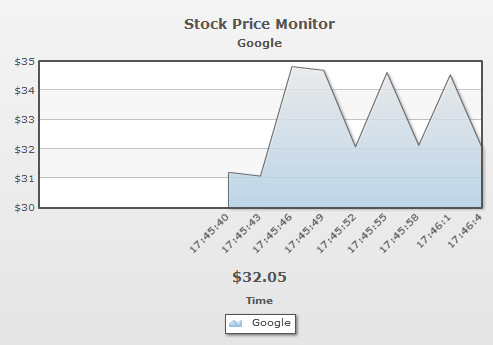
In next sections we'll see how to use <categories> and <dataset> element to push historical data, so that the chart doesn't start with an empty canvas. - We've also applied Font Styles to caption and the real-time value for better visuals.
When providing dataStreamURL path in XML/JSON, you need to make sure that:
- If there are any special characters in the URL, you'll need to URL Encode them before providing in XML. For example, if you want to set dataStreamURL as StockPrice.asp?symbol=Goog&fromId=34564, you'll need to encode it as StockPrice%2Easp%3Fsymbol%3DGoog%26fromId%3D34564
- You'll need to make sure that the chart SWF and real-time data provider page should be hosted on the same sub-domain. Else, due to cross domain restrictions in Flash Player, the chart will not be able to access the data provider page.
In this example, we've defined our data provider page as StockPrice.asp. Instead of ASP, you can use any technology like PHP, ASP.NET, JSP, ColdFusion etc. to provide the real-time data. All you need to make sure is:
- The real-time data output is in the format specified earlier
- It doesn't contain any HTML tags
- It doesn't contain any carriage returns
For our demo, we generate random numbers between 30 and 35 and output them to the chart. The following ASP code does it:
<%@ Language=VBScript %>
<%
	'This page is meant to output the Stock Price of Google in real-time data format.
	'The data will be picked by FusionWidgets XT real-time line chart and plotted on chart.
	'You need to make sure that the output data doesn't contain any HTML tags or carriage returns.
	'For the sake of demo, we'll just be generating a random value between 30 and 35 and returning the same.
	'In real life applications, you can get the data from web-service or your own data systems, convert it into real-time data format and then return to the chart.
	'Set randomize timers on

	Randomize()
	Randomize Timer
	Dim lowerLimit, upperLimit
	Dim randomValue
	Dim dateTimeLabel
	lowerLimit = 30
	upperLimit = 35

	'Generate a random value - and round it to 2 decimal places
	randomValue = Int(Rnd()*100*(upperLimit-lowerLimit))/100+lowerLimit
	'Get label for the data - time in format hh:mn:ss
	dateTimeLabel = Datepart("h",Now()) & ":" & Datepart("n",Now()) & ":" & Datepart("s",Now())
	'Now write it to output stream
	Response.Write("&label="& dateTimeLabel & "&value=" & randomValue)
%>
The above code is pretty self explanatory. Here, we're:
- Initializing random timers to get random values
- Creating a random value between 30 and 35
- Generating the time in the hh:mm:ss format
- Finally, the output of the data is in the following format &label=hh:mm:ss&value=xx
A sample output from this code is given below:
&label=18:36:27&value=32.9
<?php
/**
 *	This page is meant to output the Stock Price of Google in real-time data format.
 *	The data will be picked by FusionWidgets XT real-time line chart and plotted on chart.
 *	You need to make sure that the output data doesn't contain any HTML tags or carriage returns.
 *	For the sake of demo, we'll just be generating a random value between 30 and 35 and returning the same.
 *
 *	In real life applications, you can get the data from web-service or your own data systems, convert it into real-time data format and then return to the chart.
 *
 */

//Generate a random value between 30 and 35
$randomValue =rand(30,35);
//Get label for the data - time in format hh:mn:ss
$dateTimeLabel = date('h:i:s');
//Now write it to output stream
print "&label=" . $dateTimeLabel . "&value=" . $randomValue;?><%@ Page Language="C#" %>
<script runat="server">
void Page_Load(Object sender, EventArgs e)
{
//Define variable
int randomValue;
string dateTimeLabel;
//Define limits
int lowerLimit = 30;
int upperLimit = 35;
//Random object
System.Random rand;
rand = new System.Random();
//Generate a random value
randomValue = (int)rand.Next(lowerLimit, upperLimit);
//Get date object
DateTime objToday = DateTime.Now;
//Create time string in hh:mm:ss format
dateTimeLabel = objToday.Hour + ":" + objToday.Minute + ":" + objToday.Second;
//Now write it to output stream
Response.Write("&label=" + dateTimeLabel + "&value=" + randomValue);
}
</script>StockPrice.aspx
<%@ Page Language="C#" AutoEventWireup="true" CodeFile="StockPrice.aspx.cs" Inherits="_Default" %>
StockPrice.aspx.cs
using System;
using System.Data;
using System.Configuration;
using System.Web;
using System.Web.Security;
using System.Web.UI;
using System.Web.UI.WebControls;
using System.Web.UI.WebControls.WebParts;
using System.Web.UI.HtmlControls;
public partial class _Default : System.Web.UI.Page
{
protected void Page_Load(object sender, EventArgs e)
{
//Define variable
int randomValue;
string dateTimeLabel;
//Define limits
int lowerLimit = 30;
int upperLimit = 35;
//Create random object
System.Random rand;
rand = new System.Random();
//Generate a random value
randomValue = (int)rand.Next(lowerLimit, upperLimit);
//Get date object
DateTime objToday = DateTime.Now;
//Create time string in hh:mm:ss format
dateTimeLabel = objToday.Hour + ":" + objToday.Minute + ":" + objToday.Second;
//Now write it to output stream
Response.Write ("&label=" + dateTimeLabel + "&value=" + randomValue);
}
}<%@ Page Language="VB" Culture="Auto" UICulture="Auto" %>
<script runat="server">
Protected Sub Page_Load(ByVal sender As Object, ByVal e As System.EventArgs)
' Define variables
Dim dateTimeLabel As String
Dim lowerLimit As Integer, upperLimit As Integer
' Set the limits
lowerLimit = 30
upperLimit = 35
' Generate a random value - and round it to 2 decimal places
Dim randomValue As Integer, randomNum As New Random
randomValue = randomNum.Next(lowerLimit, upperLimit)
' Get the time in hh:mm:ss format
Dim objToday As Date = Now
dateTimeLabel = objToday.Hour.ToString + ":" + objToday.Minute.ToString + ":" + objToday.Second.ToString
' Now write it to output stream
Response.Write("&label=" + dateTimeLabel + "&value=" + randomValue.ToString)
End Sub
</script>StockPrice.aspx
<%@ Page Language="VB" AutoEventWireup="false" CodeFile="StockPrice.aspx.vb" Inherits="StockPrice" %>
StockPrice.aspx.vb
Partial Class StockPrice
Inherits System.Web.UI.Page
Protected Sub Page_Load(ByVal sender As Object, ByVal e As System.EventArgs) Handles Me.Load
'Define variables
Dim dateTimeLabel As String
Dim lowerLimit As Integer, upperLimit As Integer
'Setting limits
lowerLimit = 30
upperLimit = 35
'Generate a random value - and round it to 2 decimal places
Dim randomValue As Integer, randomNum As New Random
randomValue = randomNum.Next(lowerLimit, upperLimit)
'Generate the x-axis label (time in hh:mm:ss format)
Dim objToday As Date = Now
dateTimeLabel = objToday.Hour.ToString + ":" + objToday.Minute.ToString + ":" + objToday.Second.ToString
'Now write it to output stream
Response.Write("&label=" + dateTimeLabel + "&value=" + randomValue.ToString)
End Sub
End Class<%@page language="java"%><%@page import="java.util.Calendar" %><%@page import="java.text.SimpleDateFormat" %><%
/**
* This page is meant to output the Stock Price of Google in real-time data format.
* The data will be picked by FusionWidgets XT real-time line chart and plotted on chart.
* You need to make sure that the output data doesn't contain any HTML tags or carriage returns.
* For the sake of demo, we'll just be generating a random value between 30 and 35 and returning the same.
* In real life applications, you can get the data from web-service or your own data systems, convert it into real-time data format and then return to the chart.
*/
/**
* Note: In order to get the output without addition of any
* carriage-returns or tab spaces, there should not be spaces or empty lines
* between scriptlet tags or at the end of the page.
**/
int lowerLimit = 30;
int upperLimit = 35;
//Generate a random value - between lower and upper limits
double randomValue = Math.random()*100*(upperLimit-lowerLimit)/100+lowerLimit;
// Next few steps, to round this double to 2 decimal places
long factor = (long)Math.pow(10,2);
// Shift the decimal the correct number of places
// to the right.
randomValue = randomValue * factor;
// Round to the nearest integer.
long tmp = Math.round(randomValue);
// Shift the decimal the correct number of places
// back to the left.
double roundedRandomValue=(double)tmp / factor;
//Get label for the data - time in format HH:mm:ss
Calendar cal = Calendar.getInstance();
SimpleDateFormat sdf = new SimpleDateFormat("HH:mm:ss");
String timeLabel = sdf.format(cal.getTime());
String dataParameters = "&label=" +timeLabel+ "&value=" +roundedRandomValue;
//Now write it to output stream
out.print(dataParameters);
%>