In our previous examples, we had always started the chart with blank canvas (no data) and had it update itself over a span of time. However, if you want the chart to initially show historical data and then keep on updating itself, you can easily do so by specifying the historical data in XML/JSON data.
<chart caption="Stock Price Monitor" subCaption="Google vs Dell" dataStreamURL="StockPriceGoogDell.asp" refreshInterval="2" numberPrefix="$" setAdaptiveYMin="1" xAxisName="Time" showRealTimeValue="1" labelDisplay="Rotate" slantLabels="1" canvasLeftMargin="50">
  <categories>
    <category label="6 mins ago"/>
    <category label="5 mins ago"/>
    <category label="4 mins ago"/>
    <category label="3 mins ago"/>
    <category label="2 mins ago"/>
    <category label="1 min ago"/>
  </categories>
  <dataset seriesName="Google" showValues="0">
    <set value="32.34"/>
    <set value="34.35"/>
    <set value="31.25"/>
    <set value="33.23"/>
    <set value="31.34"/>
    <set value="33.76"/>
  </dataset>
  <dataset seriesName="Dell" showValues="0">
    <set value="22.34"/>
    <set value="22.34"/>
    <set value="24.75"/>
    <set value="23.34"/>
    <set value="21.23"/>
    <set value="23.65"/>
  </dataset>
  <styles>
    <definition>
      <style type="font" name="captionFont" size="14"/>
    </definition>
    <application>
      <apply toObject="Realtimevalue" styles="captionFont"/>
    </application>
  </styles>
</chart>
{
  "chart": {
    "caption": "Stock Price Monitor",
    "subcaption": "Google vs Dell",
    "datastreamurl": "StockPriceGoogDell.asp",
    "refreshinterval": "2",
    "numberprefix": "$",
    "setadaptiveymin": "1",
    "xaxisname": "Time",
    "showrealtimevalue": "1",
    "labeldisplay": "Rotate",
    "slantlabels": "1",
    "canvasLeftMargin": "50"
  },
  "categories": [
    {
      "category": [
        {
          "label": "6 mins ago"
        },
        {
          "label": "5 mins ago"
        },
        {
          "label": "4 mins ago"
        },
        {
          "label": "3 mins ago"
        },
        {
          "label": "2 mins ago"
        },
        {
          "label": "1 min ago"
        }
      ]
    }
  ],
  "dataset": [
    {
      "seriesname": "Google",
      "showvalues": "0",
      "data": [
        {
          "value": "32.34"
        },
        {
          "value": "34.35"
        },
        {
          "value": "31.25"
        },
        {
          "value": "33.23"
        },
        {
          "value": "31.34"
        },
        {
          "value": "33.76"
        }
      ]
    },
    {
      "seriesname": "Dell",
      "showvalues": "0",
      "data": [
        {
          "value": "22.34"
        },
        {
          "value": "22.34"
        },
        {
          "value": "24.75"
        },
        {
          "value": "23.34"
        },
        {
          "value": "21.23"
        },
        {
          "value": "23.65"
        }
      ]
    }
  ],
  "styles": {
    "definition": [
      {
        "type": "font",
        "name": "captionFont",
        "size": "14"
      }
    ],
    "application": [
      {
        "toobject": "Realtimevalue",
        "styles": "captionFont"
      }
    ]
  }
}
As you can see above, we've:
- Added <category> element to create the historical x-axis labels
- Within each dataset, we've created an equal number of <set> element - equal to number of <category> element. Each <set> element within <dataset> element represents one data point for that dataset.
When you now see the chart, you'll get something as under:
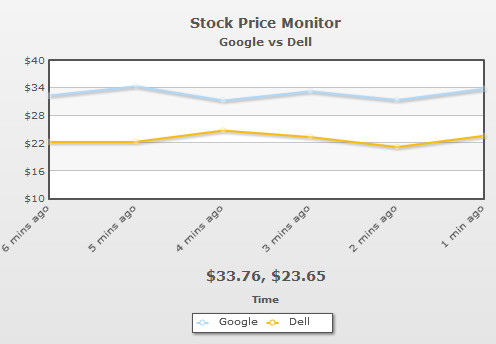
Shown above is the chart when it initializes. You can see historical data being shown.
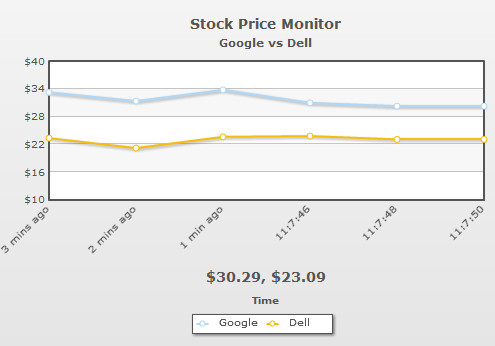
And the same chart after a few updates.
As you can see, the chart now shows only 6 points in the chart. This is because when you specify historical data and do not specify numDisplaySets attribute, the chart shows only that many number of data points as specified in historical data.
If you need to increase the number of points, you'll need to set it as under:
This will enable the chart to show 20 data points for each dataset, as shown under:
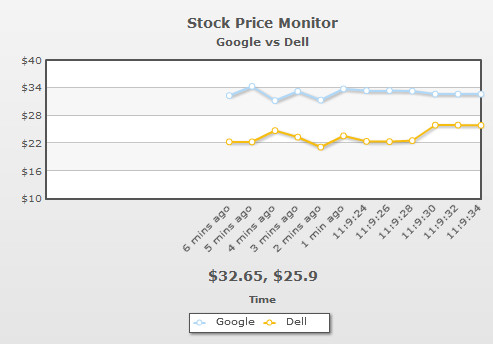
The space on left will be filled as and when chart receives more incremental data.
Also, now, in this case if you've more than 20 historical data, the chart will show only the last 20 and ignore the others.