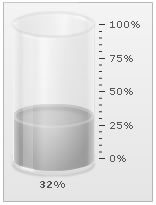
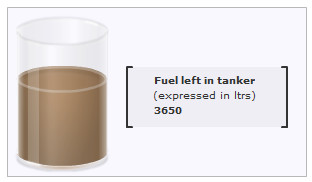
The cylinder gauge is represented by a vertical cylinder, whose fill level indicates the data that you wish to depict. It is used to report inventory levels, power plant reports, fuel levels etc.
The FusionWidgets XT cylinder gauge is a real-time chart, which can update its data at every specified interval, without requiring any page refreshes.
Some of the cylinder charts that you can create with FusionWidgets XT have been reproduced below:
 |
 |
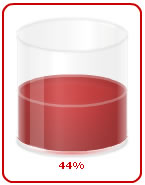 |
The cylinder gauge is different from the other gauges in the aspect that it doesn’t need a pre-defined color range. Instead, it takes in the fill color as an attribute and uses that color to fill up the cylinder.
To create a FusionWidgets XT Cylinder Gauge chart, you need to:
- Decide the upper and lower limits for the gauge
- Decide the visual properties of the gauge
- Decide the gauge value along with the fill color code
Let’s quickly see the anatomy of a cylinder gauge.