You are viewing documentation for an older version. For current documentation - click here.

A cylinder gauge chart consists of the following elements:

Here we’ll see each of them in detail. Let’s first have a look at a standard cylinder chart enlisting the various basic components:


Cylinder Fill

The cylinder is the main component in a cylinder chart – the percentage of cylinder filled helps the end user to decipher the value being illustrated.

Tick Marks

Tick marks are the calibration marks on the vertical scale to the left/right of the cylinder to help interpret the reading. There are two types of tick marks which can be drawn on the chart:

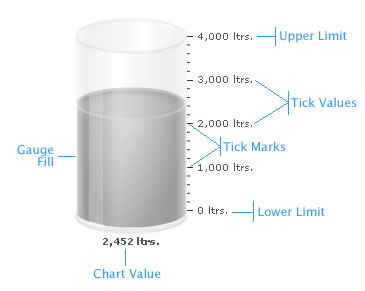
  • Major Tick Marks – These are the bigger lines on the tick mark scale.
  • Minor Tick Marks – These are the smaller lines enclosed within the bigger lines.

Chart value

The value display box helps you display the value of the cylinder fill.

Annotations

Annotations allow you to draw your own custom shapes, text, or load images on the chart.

Now that we are aware of the basic components that make up a cylinder gauge, let's go ahead to build a sample cylinder gauge.