For each <annotationGroup>, you can define its initial visibility using:
This allows the annotation group to be hidden initially. Later, you can show/hide the group using:
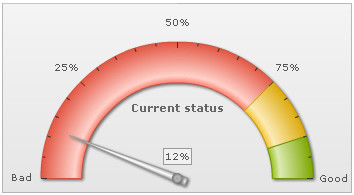
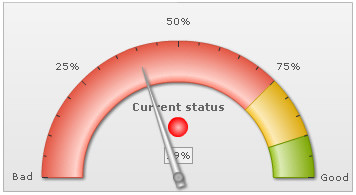
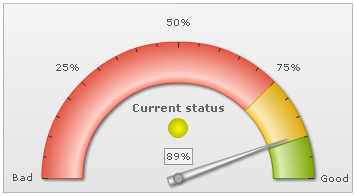
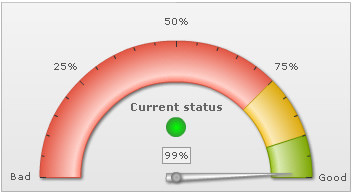
Let's consider an example where we're plotting a real-time chart. Now, based on the last value received, we need to show a visual status indicator. To create the visual indicator, we defined three annotation groups each containing one of these sphere:
- A red sphere
- A yellow sphere
- A green sphere
All these spheres are different in different annotation groups, but at the same x and y position. We also specify the annotation group IDs as GRPRED, GRPYELLOW, GRPGREEN. We hide all the groups by setting visible='0'.
Now, we activate the alert manager for the chart to show the required group, as and when the value enters that zone. Shown below is the XML/JSON data for the chart:
<chart lowerLimit="0" upperLimit="100" lowerLimitDisplay="Bad" upperLimitDisplay="Good" gaugeStartAngle="180" gaugeEndAngle="0" palette="1" numberSuffix="%" tickValueDistance="20" showValue="1" decimals="0" dataStreamURL="CPUData.asp" refreshInterval="3">
  <colorRange>
    <color minValue="0" maxValue="75" code="FF654F"/>
    <color minValue="75" maxValue="90" code="F6BD0F"/>
    <color minValue="90" maxValue="100" code="8BBA00"/>
  </colorRange>
  <dials>
    <dial id="CS" value="12" rearExtension="10"/>
  </dials>
  <annotations>
    <annotationGroup x="175" y="105">
      <annotation type="text" x="0" y="0" label="Current status" align="center" bold="1" color="666666" size="11"/>
    </annotationGroup>
    <annotationGroup Id="GRPRED" x="175" y="125" visible="0">
      <annotation type="circle" x="0" y="0" radius="10" fillPattern="radial" color="FFBFBF,FF0000" showBorder="0"/>
    </annotationGroup>
    <annotationGroup Id="GRPYELLOW" x="175" y="125" visible="0">
      <annotation type="circle" x="0" y="0" radius="10" fillPattern="radial" color="FFFF00,BBBB00" showBorder="0"/>
    </annotationGroup>
    <annotationGroup Id="GRPGREEN" x="175" y="125" visible="0">
      <annotation type="circle" x="0" y="0" radius="10" fillPattern="radial" color="00FF00,339933" showBorder="0"/>
    </annotationGroup>
  </annotations>
  <alerts>
    <alert minValue="0" maxValue="75" action="showAnnotation" param="GRPRED"/>
    <alert minValue="75" maxValue="90" action="showAnnotation" param="GRPYELLOW"/>
    <alert minValue="90" maxValue="100" action="showAnnotation" param="GRPGREEN"/>
  </alerts>
  <styles>
    <definition>
      <style type="font" name="myValueFont" bgColor="F1f1f1" borderColor="999999"/>
    </definition>
    <application>
      <apply toObject="Value" styles="myValueFont"/>
    </application>
  </styles>
</chart>
{
  "chart": {
    "lowerlimit": "0",
    "upperlimit": "100",
    "lowerlimitdisplay": "Bad",
    "upperlimitdisplay": "Good",
    "gaugestartangle": "180",
    "gaugeendangle": "0",
    "palette": "1",
    "numbersuffix": "%",
    "tickvaluedistance": "20",
    "showvalue": "1",
    "decimals": "0",
    "datastreamurl": "CPUData.asp",
    "refreshinterval": "3"
  },
  "colorrange": {
    "color": [
      {
        "minvalue": "0",
        "maxvalue": "75",
        "code": "FF654F"
      },
      {
        "minvalue": "75",
        "maxvalue": "90",
        "code": "F6BD0F"
      },
      {
        "minvalue": "90",
        "maxvalue": "100",
        "code": "8BBA00"
      }
    ]
  },
  "dials": {
    "dial": [
      {
        "id": "CS",
        "value": "12",
        "rearextension": "10"
      }
    ]
  },
  "annotations": {
    "groups": [
      {
        "x": "175",
        "y": "105",
        "items": [
          {
            "type": "text",
            "x": "0",
            "y": "0",
            "label": "Current status",
            "align": "center",
            "bold": "1",
            "color": "666666",
            "size": "11"
          }
        ]
      },
      {
        "id": "GRPRED",
        "x": "175",
        "y": "125",
        "visible": "0",
        "items": [
          {
            "type": "circle",
            "x": "0",
            "y": "0",
            "radius": "10",
            "fillpattern": "radial",
            "color": "FFBFBF,FF0000",
            "showborder": "0"
          }
        ]
      },
      {
        "id": "GRPYELLOW",
        "x": "175",
        "y": "125",
        "visible": "0",
        "items": [
          {
            "type": "circle",
            "x": "0",
            "y": "0",
            "radius": "10",
            "fillpattern": "radial",
            "color": "FFFF00,BBBB00",
            "showborder": "0"
          }
        ]
      },
      {
        "id": "GRPGREEN",
        "x": "175",
        "y": "125",
        "visible": "0",
        "items": [
          {
            "type": "circle",
            "x": "0",
            "y": "0",
            "radius": "10",
            "fillpattern": "radial",
            "color": "00FF00,339933",
            "showborder": "0"
          }
        ]
      }
    ]
  },
  "alerts": {
    "alert": [
      {
        "minvalue": "0",
        "maxvalue": "75",
        "action": "showAnnotation",
        "param": "GRPRED"
      },
      {
        "minvalue": "75",
        "maxvalue": "90",
        "action": "showAnnotation",
        "param": "GRPYELLOW"
      },
      {
        "minvalue": "90",
        "maxvalue": "100",
        "action": "showAnnotation",
        "param": "GRPGREEN"
      }
    ]
  },
  "styles": {
    "definition": [
      {
        "type": "font",
        "name": "myValueFont",
        "bgcolor": "F1f1f1",
        "bordercolor": "999999"
      }
    ],
    "application": [
      {
        "toobject": "Value",
        "styles": "myValueFont"
      }
    ]
  }
}
As you can see above, here we've defined the three annotation groups (each containing a colored sphere) with visible='0'. Thereafter, we've defined the alert manager to show each of the annotation group, based on the last value received.
When run against an angular gauge, you'll see the following chart when initialized (note that no sphere annotation groups are initially visible):