The annotations can be controlled by JavaScript using the following methods:
| Function Name | Parameter | Description |
| showAnnotation(strGroupID) | strGroupID | Shows an annotation with the specified group ID. |
| hideAnnotation(strGroupID) | strGroupID | Hides an annotation with the specified group ID. |
To use any of these methods, you need to refer to the chart and then call any of these methods. To refer to a chart, you can use the DOMID of the chart and pass it using any of the following ways:
var chartRef = FusionCharts("myChartId");
or
var chartRef = FusionCharts.items["myChartId"];
The legacy function getChartFromId() still works as show below:
var chartRef = getChartFromId("myChartId");
However, note that getChartFromId() has been deprecated.
You can call the JavaScript APIs of a chart only after it has rendered. You can use the FC_Rendered event tracker or the Rendered event listener to check if a chart has rendered. For more information, please see FusionWidgets XT and JavaScript section.
The code below shows how to hide and show annotations in an Angular gauge:
<html>
<head>
<title>FusionWidgets XT - JS API</title>
<script type="text/javascript" src="../Charts/FusionCharts.js"></script>
</head>
<body>
<div id="chart1div">This text is replaced by the gauge</div>
<script type="text/javascript">
// Create a gauge with a gold dial and a gray dial (Using Annotation Groups)
// <annotationGroup id="blueTheme" ...>
// <annotationGroup id="grayTheme" visible="0" ...>
// The gray dial group is set to in-visible <annotationGroup visible='0' ...>
var chart1 = new FusionCharts("../Charts/AngularGauge.swf", "ChId1", "280", "280", "0", "1");
chart1.setXMLUrl("Data.xml");
chart1.render("chart1div");
</script>
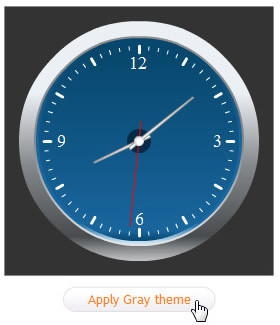
<input value="Apply Gray Theme" type="button" onclick="FusionCharts('ChId1').showAnnotation('grayTheme'); FusionCharts('ChId1').hideAnnotation('blueTheme');" />
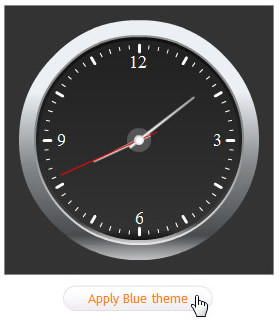
<input value="Apply Blue Theme" type="button" onclick="FusionCharts('ChId1').showAnnotation('blueTheme'); FusionCharts('ChId1').hideAnnotation('grayTheme');" />
</body>
</html>
See it live!
The code renders a clock with a blue dial. When Apply Gray Theme button is clicked, the blue dial disappears and a dark gray dial appears as shown below:
 |
 |
While accessing any of the JavaScript methods listed above, if you get an error like "... is not a function of ...", make sure of the following points:
- Make sure that you're not calling the JavaScript method before the chart has loaded and rendered. You need to use the FC_Rendered function or define event listener for Rendered event of chart, to track the loading of chart as explained in the FusionWidgets XT and JavaScript section.
- Make sure that you're NOT running the chart from local file system (C:\ , D:\). Instead, run the chart from behind a server (localhost - IIS, Apache etc.). This is because the Flash Player security settings do not allow the chart to interact with JavaScript on local file system by default, unless otherwise specifically set.