FusionCharts for Flex > Quick Chart Configuration > Vertical Separator Lines
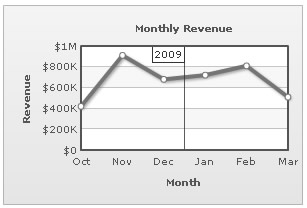
vLines are vertical (or horizontal in case of bar charts) separator lines that help to separate blocks of data. They can be placed between any two data points, even at irregular intervals.
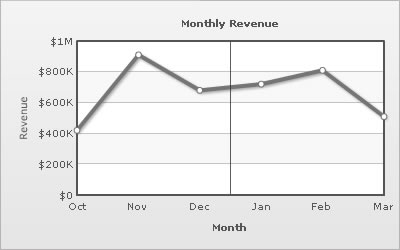
The XML for the above chart is as follows:
<chart caption='Monthly Revenue' xAxisName='Month' yAxisName='Revenue' numberPrefix='$' showValues='0'>
    <set label='Oct' value='420000' />
    <set label='Nov' value='910000' />
    <set label='Dec' value='680000' />
    <vLine/>
    <set label='Jan' value='720000' />
    <set label='Feb' value='810000' />
    <set label='Mar' value='510000' />
</chart>
As you can see, a vertical separator line is introduced in the chart using the <vLine> element between the <set> elements, where you want it to be placed.
Configuring the position of vertical line
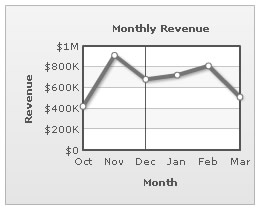
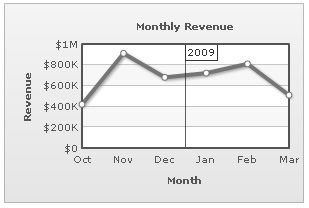
By default, when you add a "vLine" to the chart, it appears between the two data points visually. You can, however, place it anywhere between those two data points by setting the value of linePosition attribute between 0 and 1. 0 places the vertical line at the position of previous data and 1 at the next data. Example:
<chart caption='Monthly Revenue' xAxisName='Month' yAxisName='Revenue' numberPrefix='$' showValues='0'>
   <set label='Oct' value='420000' />
   <set label='Nov' value='910000' />
   <set label='Dec' value='680000' />
   <vLine linePosition='0'/>
   <set label='Jan' value='720000' />
   <set label='Feb' value='810000' />
   <set label='Mar' value='510000' />
</chart>
This results in:
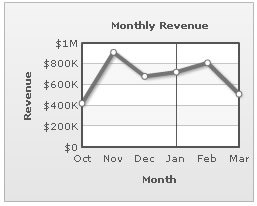
Setting linePosition to 1 in the same XML results in:
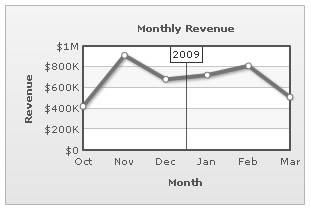
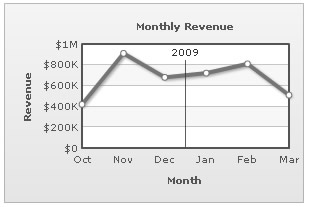
Adding labels to vertical lines
You can add a label to vertical line by setting <vLine label='Your text' ..>. The following XML causes to add labels to the vertical lines.
<chart caption='Monthly Revenue' xAxisName='Month' yAxisName='Revenue' numberPrefix='$' showValues='0'>
   <set label='Oct' value='420000' />
   <set label='Nov' value='910000' />
   <set label='Dec' value='680000' />
   <vLine label='2009'/>
   <set label='Jan' value='720000' />
   <set label='Feb' value='810000' />
   <set label='Mar' value='510000' />
</chart>
This results in:
Configuring Label Position
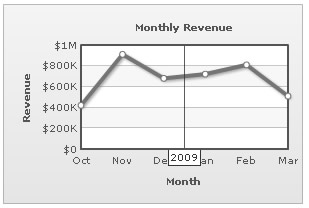
The label can be configured to display either at the top of the canvas (labelPosition='0') or at the bottom (labelPosition='1') or anywhere in between. To show the label at bottom of canvas, we use the following code:
<chart caption='Monthly Revenue' xAxisName='Month' yAxisName='Revenue' numberPrefix='$' showValues='0'>
   <set label='Oct' value='420000' />
   <set label='Nov' value='910000' />
   <set label='Dec' value='680000' />
   <vLine label='2009' labelPosition='1'/>
   <set label='Jan' value='720000' />
   <set label='Feb' value='810000' />
   <set label='Mar' value='510000' />
</chart>
This results in:
Turning Label borders on/off
The label can be configured not to have any borders in chart level as well as in vLine level. To do this set <chart showVLineLabelBorder='0' ..> in the chart level or set <vLine showLabelBorder='0' ..> at individual vLine level. This results in:
Label alignment configuration
The label can be configured to anchor at left, center (default), or right. To configure this, set <vLine ... labelHAlign='left'...>. Shown below are examples:
| labelHAlign='left' | labelHAlign='right' |
|---|---|
 |
 |
Similarly, the vertical position can be set as top, middle (default), or bottom as value of labelVAlign attribute.
| Attribute Name | Range | Description |
|---|---|---|
| label | String | Label of the vertical line |
| showLabelBorder | Boolean 0/1 | Whether to show border for this vertical line label. |
| linePosition | 0-1 | Position of the line between the 2 data points |
| labelPosition | 0-1 | Position of the label (ranging from top of canvas to bottom) |
| labelHAlign | left, center or right | Horizontal anchor point for vLine label |
| labelVAlign | top, middle or bottom | Vertical anchor point for vLine label |
Customizing the looks of the separator line
The appearance of the vertical separator line can be customized using the attributes of the <vLine> element given below:
| Attribute Name | Range | Description |
|---|---|---|
| color | Hex Color | This attribute defines the color of vertical separator line. |
| thickness | In Pixels | Thickness in pixels of the vertical separator line. |
| alpha | 0-100 | Alpha of the vertical separator line. |
<vLine color='999999' thickness='2' alpha='60' />
Dashed vertical separator lines
The vertical separator lines can be made dashed by setting dashed='1' in the <vLine> element.
The dash properties - dash length and dash gap can be customized using the dashLen and dashGap attributes respectively.
<vLine dashed='1' dashLen='2' dashGap='2'/>
Using Styles to animate vertical separator lines
Animation effects are applied to the vertical separator lines using STYLES. The following XML would cause the y-Scale of the separator lines to animate.
<chart caption='Monthly Revenue' xAxisName='Month' yAxisName='Revenue' numberPrefix='$' showValues='0'>
    <set label='Oct' value='420000' />
    <set label='Nov' value='910000' />
    <set label='Dec' value='680000' />
    <vLine/>
    <set label='Jan' value='720000' />
    <set label='Feb' value='810000' />
    <set label='Mar' value='510000' />
    <styles>
        <definition>
            <style name='myAnim' type='animation' param='_yScale' start='0' duration='1'/>
        </definition>
        <application>
            <apply toObject='VLINES' styles='myAnim' />
        </application>
    </styles>
</chart>