FusionCharts for Flex > Quick Chart Configuration > Smart Labels & Lines
Smart labels are the labels for the pie/doughnut chart. The smart labels prevent overlapping of labels even when a large number of labels is placed in close vicinity.
You can disable the smart labels (if required to save chart space or when there are few pie segments) using enableSmartLabels='0'. When the smart labels are switched off, the pie labels would be displayed without the smart label lines. But if the number of labels increases and smart labels are not being used, then the labels might overlap.
<chart enableSmartLabels='0'...>
Customizing the smart labels
The smart labels can be customized using the following attributes:
| Attribute Name | Range | Description |
|---|---|---|
| smartLineColor | Hex Code | Color of smart label connector lines |
| smartLineThickness | In Pixels | Thickness of smart label connector lines |
| smartLineAlpha | 0-100 | Alpha of smart label connector lines |
| isSmartLineSlanted | 0/1 | The smart lines (smart label connector lines) can appear in two ways: Slanted or Straight. This attribute lets you choose between them |
<chart smartLineThickness='2' smartLineColor='333333' isSmartLineSlanted='0'...>
Label Clearance
You can set the label distance and clearance using the following attributes:
| Attribute Name | Range | Description |
|---|---|---|
| labelDistance | In Pixels | This attribute helps to set the distance of the label/value text boxes from the pie/doughnut edge. This attribute is applicable only when smart labeling is disabled. |
| smartLabelClearance | In Pixels | Clearance distance of a label (for sliced-in pies) from adjacent sliced out pies. |
Skipping Overlap labels
When you have too many labels in your pie chart (which is difficult to adjust even using smart labels), the labels might overlap. In that case, you have the option to skip the overlapping labels using skipOverlapLabels='1'. The labels of the least significant pies would be removed.
Displaying values
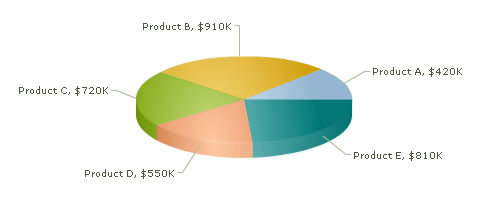
You can set whether you want the actual value of the pie segment to be displayed in the label or the percentage value. By default, the actual values are displayed ($550K, $720K in the chart shown above). When you want to display their percentages, use showPercentValues='1'.
<chart showPercentValues='1'...>