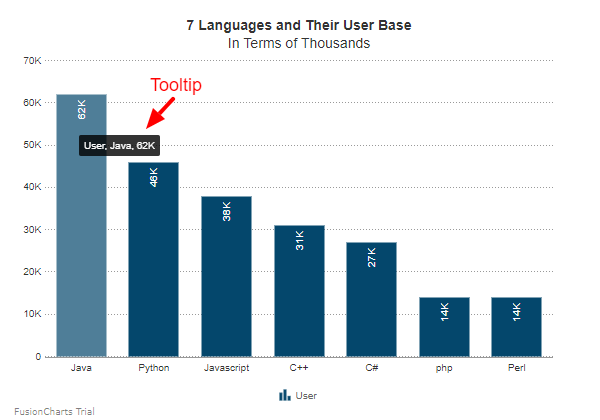
Tooltip
A tooltip is a small box that pops up when you hover the mouse pointer over a particular data point. It displays context-sensitive information about the data point, which can include the name of the data series that the plot belongs to and it's value in whole number/percentage.
In the image given below, you can see a tooltip labeled:

Customize Tooltips
You can customize tooltips by using different properties of the ToolTip object in an object.
Show/Hide Tooltips
To hide tooltips, set the value of the Show properties to true. Refer to the code given below:
visualizationObj.ToolTip.Show = true;Customize Background Color
Use the hex code type BGColor properties to set the background color for tooltips. Refer to the code given below:
visualizationObj.ToolTip.BGColor = "#ffffff";Customize Border Color
Use the hex code type BorderColor properties to set the border color for tooltips. Refer to the code given below:
visualizationObj.ToolTip.BorderColor = "#000000";Customize Separator Character
Use the character type SepChar properties to set the separator character, which should be displayed in tooltips. This will come in handy when you want to display multiple data values in the tooltip. Refer to the code given below:
visualizationObj.ToolTip.SepChar = '/';|Display Tooltip Shadow
Use the boolean type ShowShadow properties to set whether a shadow should be displayed below the tooltip. Refer to the code given below:
visualizationObj.ToolTip.ShowShadow = false;Customize Tooltip Text Color
Use the hex code type Color properties to set the text color for tooltips. Refer to the code given below:
visualizationObj.ToolTip.Color = "000000";Set Border Transparency
Use the integer type BorderAlpha properties to set the transparency of the tooltip border. BorderAlpha accepts values between 0 (transparent) and 100 (opaque). Refer to the code given below:
visualizationObj.ToolTip.BorderAlpha = 100;Set Tooltip Text
Use the string type PlotToolText properties to set the text for a tooltip. Refer to the code given below:
visualizationObj.ToolTip.PlotToolText = "Column Chart Tooltip Text";The chart is shown below: