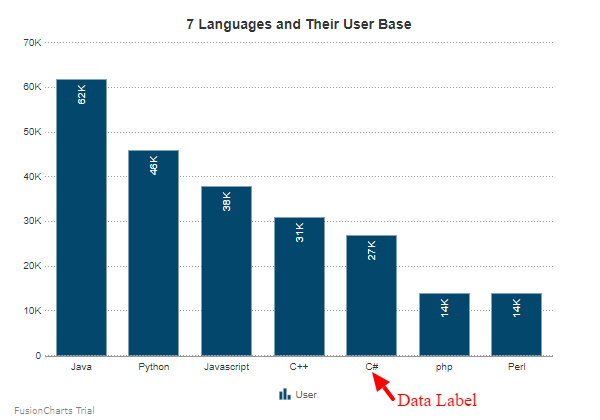
Data Labels
Data labels are the names you assign to data points on the X-axis. In FusionCharts.NET, apart from setting values for the data labels, you can also apply several types of formatting to them.

Customize Data Labels
In FusionCharts.NET, you can customize data labels in the following ways with the help of different instance methods of the LabelFormatting object (which accepts a string argument) under the Data object, which is in turn under the visualizationObj object:
Show/Hide Data Labels
To hide the data labels, set the value of the ShowLabel properties to false. Refer to the code given below:
visualizationObj.Data.Categories.CategoryFormatting("C#").ShowLabel("false");The chart will look as shown below:
Set Data Label Text
Set the tooltip text for the data label as string to the ToolText properties. Refer to the code given below:
visualizationObj.Data.Categories.CategoryFormatting("C#").ToolText("Programming Language:C#");The chart will look as shown below:
Customize Font Properties
Customize the font properties of the data label using the following:
- Set the font size as an integer using the
FontSizeproperties. - Set the font type as string using the
FontNameproperties. - Set the font color as hex code using the
FontColorproperties. - Display the title as bold by setting the
Boldproperties totrue. - Display the title as bold by setting the
Italicproperties totrue.
Refer to the code given below:
visualizationObj.Data.Categories.CategoryFormatting("C#").FontSize(18);
visualizationObj.Data.Categories.CategoryFormatting("C#").FontName("Arial");
visualizationObj.Data.Categories.CategoryFormatting("C#").FontColor("#5d62b5");
visualizationObj.Data.Categories.CategoryFormatting("C#").Bold(true);
visualizationObj.Data.Categories.CategoryFormatting("C#").Italic(true);The chart will look as shown below:
Link Labels to External Resources
To link a data label to an external resource, set the value of the LabelLink properties to the link of the resource. Refer to the code given below:
visualizationObj.Data.Categories.CategoryFormatting("C#").LabelLink("https://www.fusioncharts.com/");The chart will look as shown below:
In the above chart click on the xaxis label C#.
Set Border Color of Label
Set the border color of the label as hex code using the BorderColor properties. Refer to the code given below:
visualizationObj.Data.Categories.CategoryFormatting("C#").BorderColor("#87919b");The chart will look as shown below:
Set Background Color of Label
Set the background color of the label as hex code using the BGColor properties. Refer to the code given below:
visualizationObj.Data.Categories.CategoryFormatting("C#").BGColor("d9d9d9");The chart will look as shown below:
Set Transparency of Label
Set the transparency of the label between 0 (transparent) and 100 (opaque) using the Alpha properties. Refer to the code given below:
visualizationObj.Data.Categories.CategoryFormatting("C#").Alpha(50);The chart will look as shown below: