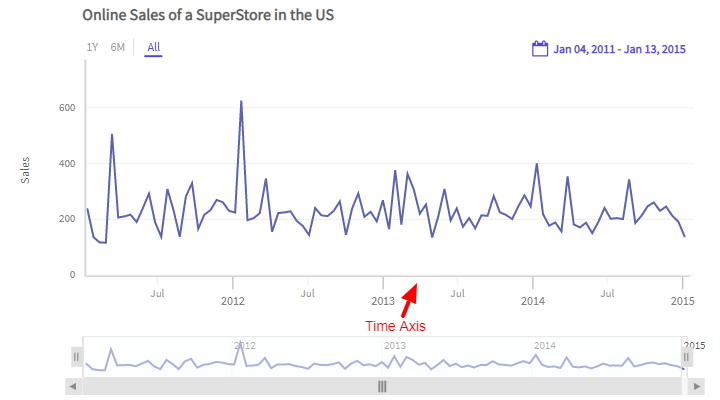
Time Axis
The X-axis of a timeseries chart displays time-based data and is known as the Time Axis. Based on the atomicity of the data and the active window (of the time navigator) the time axis intelligently creates a timescale to display the chart data. Refer to the image below:
Configure Time Axis
You can set the plot name for the time axis using the PlotName method of the TimeAxis object within the timeSeries class. Refer to the code given below:
/* plot name */
timeSeries.TimeAxis.PlotName = "Order Date";The Time Axis will look as shown below:
Loading data for chart…