Export FusionTime charts
Note: You need FusionExport v1.2.3 and above to be able to export FusionTime charts. You can check the version of your package by using -v option. In case of if you are using older version, visit the download page to download the latest version of FusionExport.
Exporting charts built using FusionCharts is a straightforward affair. All you have to do is, pass the chart configurations to chartConfig and you are done. With FusionTime things are little different. Since, FusionTime uses DataStore which consists of data and schema, simply passing the data to dataSource or any other property does not work. In this tutorial we will learn how to overcome this issue.
Perquisites
Before you learn how to export FusionTime charts, make sure you are aware of following steps:
- Downloaded and installed FusionExport Server, and the server is running
- Downloaded and installed the FusionExport SDK client
- Created your first time-series chart using FusionTime
Understanding the API
As mentioned earlier, FusionTime works on top of DataStore. DataStore is an in-memory (browser based) RDBS data store. It uses browser based capabilities to manipulate the data. In this case, to read the data present in Data Store, we have introduced two new properties: data and schema which you have to pass it to dataSource while defining chartConfig. Here is one example in JSON format (for non-Node.js based SDKs you can use native objects/dictionary as well):
{
"type": "timeseries",
"renderAt": "chart-container",
"dataSource": {
"data": {
"data": "<data_url> | <data_object>",
"schema": "<data_url> | <data_object>"
},
"caption": {
"text": "Sales Analysis json data all"
},
...
...
...
}As you can see, we are using two new properties:
schema: Schema of the data which you have defined in FusionTime. You can pass it as a URL, a JSON object or native object as well.data: Pass your data which you are using to render the FusionTime chart. You can either pass it as an URL, JSON data or native object. Please make sure that the data is in accordance to the schema you have defined.
In case if you find the concept of data and schema confusing, we highly recommend you to learn how create a time-series chart.
Implementation
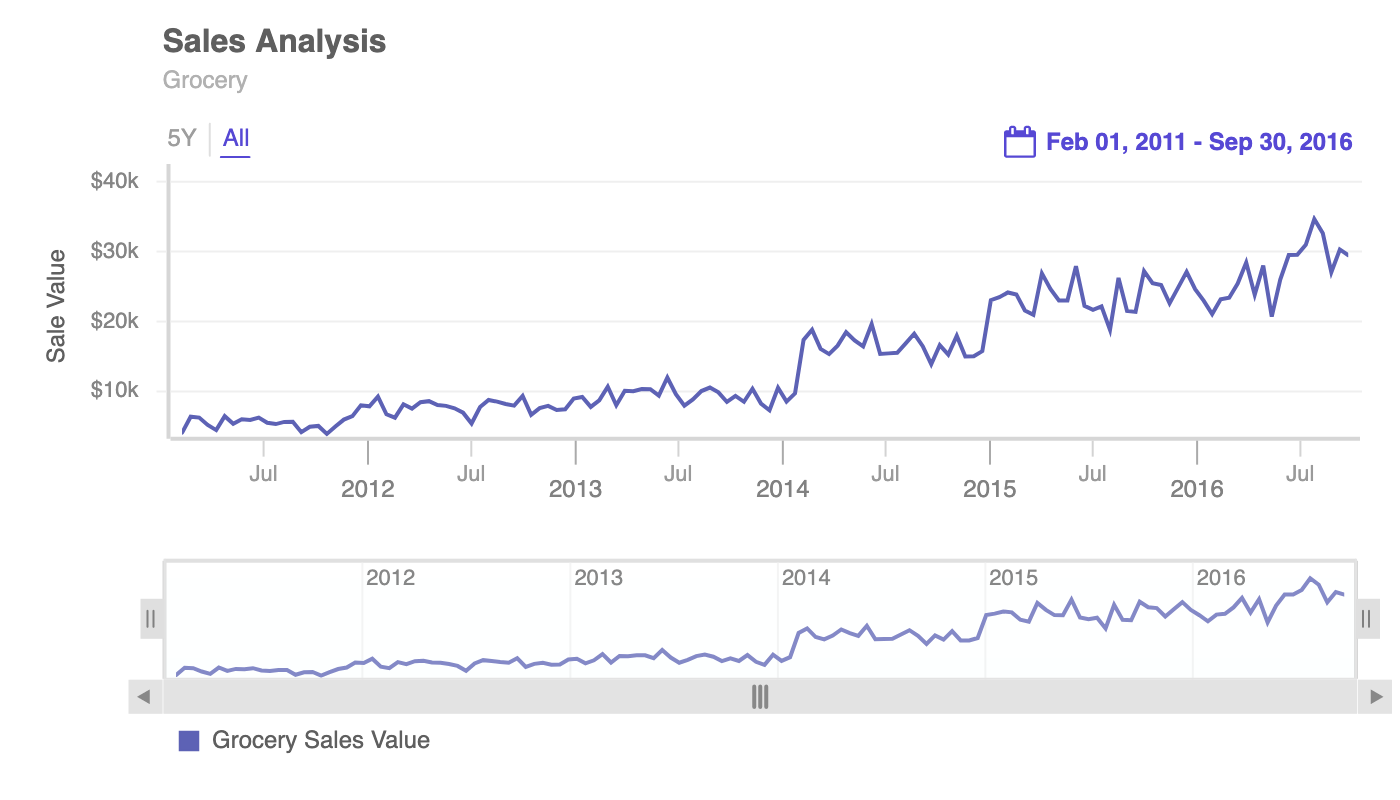
In this tutorial, we will be exporting following chart:
Source code of this chart is as follows:
Promise.all([
loadData('https://s3.eu-central-1.amazonaws.com/fusion.store/ft/data/line-chart-with-time-axis-data.json'),
loadData('https://s3.eu-central-1.amazonaws.com/fusion.store/ft/schema/line-chart-with-time-axis-schema.json')
]).then(res => {
const data = res[0];
const schema = res[1];
const dataStore = new FusionCharts.DataStore(data, schema);
new FusionCharts({
type: 'timeseries',
renderAt: 'chart-container',
width: '100%',
height: '100%',
dataSource: {
// Initially data is set as null
caption: {
text: "Sales Analysis"
},
subcaption: {
text: "Grocery"
},
yAxis: [
{
plot: {
value: "Grocery Sales Value",
type: "line"
},
format: {
prefix: "$"
},
title: "Sale Value"
}
],
data: dataStore.getDataTable(),
},
}).render();
});As mentioned in the earlier example, data which you have assigned for data and schema variables, we will passing that to data and schema property in dataSource. Here is the implementation of the above code:
using System;
using System.Collections.Generic;
using System.IO;
using System.Linq;
using FusionCharts.FusionExport.Client; // Import sdk

namespace FusionExportTest
{
    public static class TimeSeries
    {
        public static void Run(string host = Constants.DEFAULT_HOST, int port = Constants.DEFAULT_PORT)
        {
            // Instantiate the ExportConfig class and add the required configurations
            ExportConfig exportConfig = new ExportConfig();
            List results = new List();

            // Instantiate the ExportManager class
            using (ExportManager exportManager = new ExportManager())
            {
                exportConfig.Set("chartConfig", File.ReadAllText("./resources/timeseries-config.json"));
                exportConfig.Set("quality", "best");

                // Call the Export() method with the export config
                results.AddRange(exportManager.Export(exportConfig));
            }

            foreach (string path in results)
            {
                Console.WriteLine(path);
            }

            Console.Read();

        }
    }
}
const { ExportManager, ExportConfig } = require("..");

// Instantiate ExportManager
const exportManager = new ExportManager();
const exportConfig = new ExportConfig();

const chartConfig = [
  {
    type: "timeseries",
    renderAt: "chart-container",
    width: 700,
    height: 400,
    creditLabel: false,
    dataSource: {
      data: {
        data: "https://s3.eu-central-1.amazonaws.com/fusion.store/ft/data/line-chart-with-time-axis-data.json",
        schema: [
          {
            name: "Time",
            type: "date",
            format: "%d-%b-%y",
          },
          {
            name: "Grocery Sales Value",
            type: "number",
          },
        ],
      },
      caption: {
        text: "Sales Analysis",
      },
      subCaption: {
        text: "Grocery",
      },
      yAxis: [
        {
          plot: {
            value: "Grocery Sales Value",
          },
          format: {
            prefix: "$",
          },
          title: "Sale Value",
        },
      ],
    },
  },
];

exportConfig.set("chartConfig", chartConfig);

// provide the export config
exportManager
  .export(exportConfig, ".", true)
  .then(exportedFiles => {
    exportedFiles.forEach(file => console.warn(file));
  })
  .catch(err => {
    console.error(err);
  });
For schema, you can also pass the URL as a parameter but for the demonstration purpose we are showing how you can pass an object. As you can see above, contents of data is assigned to dataSource.data.data while contents of schema is assigned to dataSource.data.schema. Once you execute the above code, you will get the following output:

And this is how you export your time-series chart. In case if you have any questions, feel free to get in touch with us at [email protected] or share your feedback below.