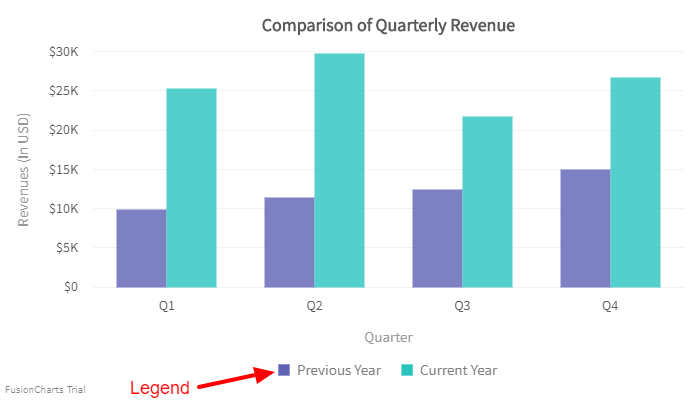
Legend
The legend is a chart element that you can use to display the name and color of a data series. It also allows you to interact with different data series when your chart data has more than one data series. This helps you relate a data plot to its series name using its color.
In the image given below, you can see the legend in a chart labeled:

Customize a Legend
You can customize a legend by assigning custom values to different properties of the Legend object in an object:
Show/Hide Legend
To hide the legend, set the value of the Show properties to false. Refer to the code given below:
visualizationObj.Legend.Show = false;Set Legend Title
Set the title of the legend as string using the Text properties. Refer to the code given below:
visualizationObj.Legend.Caption = "column chart Legend section";Set Legend Position
Set the position of the legend as BOTTOM or RIGHT using the Position properties. Refer to the code given below:
visualizationObj.Legend.Position = LegendObject.LegendPosition.Bottom;|Customize Font Properties
Customize the font properties of the legend title using the following:
- Set the font size as an integer using the
FontSizeproperties. - Set the font type as string using the
FontNameproperties. - Set the font color as hex code using the
FontColorproperties. - Display the title as bold by setting the
Boldproperties totrue.
Refer to the code given below:
visualizationObj.Legend.FontSize = 16;
visualizationObj.Legend.FontName = "Arial";
visualizationObj.Legend.FontColor = "#000000";
visualizationObj.Legend.Bold = true;The detailed chart with all the above customizations is shown below: