Caption and Sub-Caption
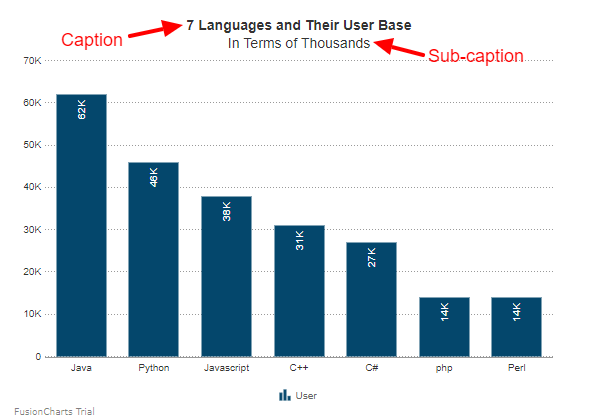
The caption (or the title) is the heading of the chart, where you state the topic your chart showcases. The sub-caption is the text you place right below the caption, with more details about the chart.
You can see both caption and sub-caption highlighted in the following image:

In this article, we will learn how to customize the chart caption and sub-caption by assigning custom values to different properties.
Caption
Customize the chart caption by setting custom values to the properties of the Caption object under the visualizationObj object, as shown below:
Caption Text
Set the caption of the chart as string to the Text properties. Refer to the code given below:
visualizationObj.Caption.Text = "chart title";Customize Font Properties
Customize the font properties of the caption using the following:
- Set the font size as an integer using the
FontSizeproperties. - Set the font type as the string using the
FontNameproperties. - Set the font color as hex code using the
FontColorproperties. - Display the title as bold by setting the
Boldproperties totrue.
Refer to the code given below:
visualizationObj.Caption.FontSize = 18;
visualizationObj.Caption.Fontname = "Arial";
visualizationObj.Caption.FontColor = "#5d62b5";
visualizationObj.Caption.Bold = true;The chart will look as shown below:
Show the Caption at the Top
Set whether the caption should appear at the top of the chart as true or false, by setting the value of the boolean type OnTop properties. Note that if you set its value to false, the caption will appear below the chart. Refer to the code given below:
visualizationObj.Caption.OnTop = true;Set Caption Alignment
Align the caption to LEFT, RIGHT, or CENTER by using the CaptionAlignment enum. Refer to the code given below:
visualizationObj.Caption.Alignment = CaptionObject.CaptionAlignment.LEFT;The chart after applying the above attributes looks like:
Sub-caption
Customize chart sub-caption by setting custom values to the properties of the SubCaption object under the visualizationObj object, as shown below.
Customize Sub-caption Text
Set the sub-caption of the chart as string to the Text properties. Refer to the code given below:
visualizationObj.SubCaption.Text = "chart subtitle";Customize Font Properties
Customize the font properties of the sub-caption using the following:
- Set the font size as an integer using the
FontSizeproperties. - Set the font type as the string using the
FontNameproperties. - Set the font color as hex code using the
FontColorproperties. - Display the title as bold by setting the
Boldproperties totrue.
Refer to the code given below:
visualizationObj.SubCaption.FontSize = 18;
visualizationObj.SubCaption.Fontname = "Arial";
visualizationObj.SubCaption.FontColor = "#5d62b5";
visualizationObj.SubCaption.Bold = true;The chart will look as shown below: