In our previous example, we saw how to change chart type. Here, we'll see how to change the chart dimensions (size).
Changing chart's width and height is as easy as changing chart type. You can set the dimensions of the chart either in terms of pixels or specify the percentage width and height of the chart relative to its container (a DIV or any other HTML element in which the chart is rendered). If the size is specified in pixels, then the chart's dimensions remain constant irrespective of the size of the container. However, if the width and height of the chart is set as percentage, then the chart can adapt itself to the change in the size of the container.
Code examples discussed in this section are present in Download Package > Code > MyFirstChart folder.
To change the width and height, all you have to do is provide the desired width and height in pixels (without appending px at end of it) while defining the chart.
Let's modify our first chart's dimensions as described below:
- Create a copy of customer-satisfaction.html and save it as change-size-pixels.html
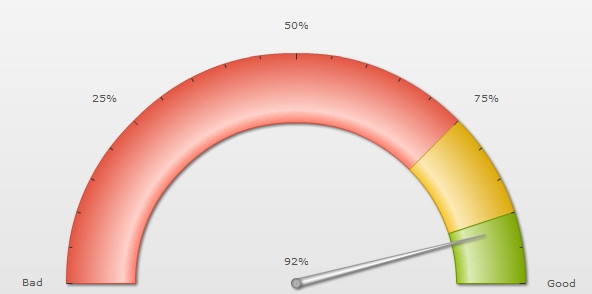
- Next, modify the width from "400" to "600" and
- Modify the height from "200" to "300"
The modified code looks as shown below:
<html>
<head>
<title>My First chart using FusionWidgets XT - change size</title>
	<script type="text/javascript" src="Charts/FusionCharts.js"></script>
</head>
<body>
	<div id="chartContainer">FusionWidgets XT will load here!</div>
	<script type="text/javascript"><!--
		var myChart = new FusionCharts( "Charts/AngularGauge.swf", "myChartId", "600", "300", "0" );
		myChart.setXMLUrl("Data.xml");
		myChart.render("chartContainer");
	// -->
	</script>
</body>
</html>
See it live!
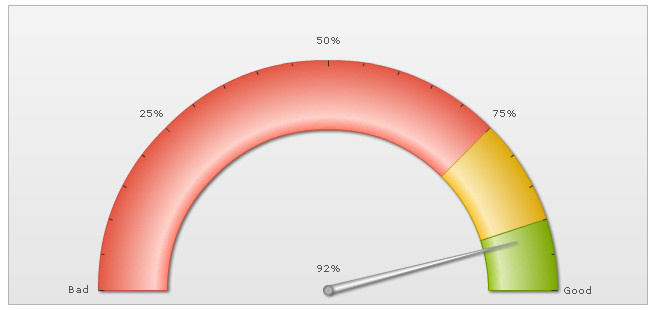
You can also set the width and height of the chart in terms of percentage. The chart will automatically adjust its dimensions with respect to the parent HTML container element. Let's see how this is done in HTML:
<html>
<head>
<title>My First chart using FusionWidgets XT - change size in percentage</title>
	<script type="text/javascript" src="Charts/FusionCharts.js"></script>
</head>
<body>
	<div id="chartContainer" style="width:800px; height:300px;">
	FusionWidgets XT will load here!</div>
	<script type="text/javascript"><!--
		var myChart = new FusionCharts( "Charts/AngularGauge.swf", "myChartId", "80%", "100%", "0" );
		myChart.setXMLUrl("Data.xml");
		myChart.render("chartContainer");
	// -->
	</script>
</body>
</html>
See it live!
In certain cases, if the container element itself failed to acquire proper width or height (due to error in rendering by browser), the chart might look squeezed, or it may not render in the first place. If this happens, then you'll either need to correct your HTML or CSS where you are setting the dimensions of the container element or you have to specify the chart's dimensions in pixels.
Starting FusionWidgets XT, a chart can dynamically resize itself when the parent container resizes. For this you need to :
- Set the chart's size in percentage, and
- Set the container's dimensions such that it can resize dynamically when the browser resizes or due to other changes taking place in the page (like when an element is added/removed or due to user interaction)
Whenever the container element resizes, the chart can also dynamically resize itself instantly. For this, you need to set manageResize='1' in the <chart> element of the XML data (or "manageResize": "1" in the chart object of the JSON data).
In the example below (saved as dynamicResize.html in MyFirstChart folder), we've created a very basic sample where the chart will fill up the whole of web browser's space and if the browser's size is changed, the chart will fit itself to the new size.
<html>
<head>
<title>My First chart using FusionWidgets XT - Using dynamically re sizable chart</title>
	<script type="text/javascript" src="Charts/FusionCharts.js"></script>
</head>
<body style="height:100%;">
	<div id="chartContainer" style="height:100%;" >
	FusionWidgets XT will load here</div>
	<script type="text/javascript"><!--
		var myChart = new FusionCharts("Charts/AngularGauge.swf",
		"myChartId", "100%", "100%", "0");
		myChart.setXMLUrl("Data.xml");
		myChart.render("chartContainer");
	// -->
	</script>
</body>
</html>
See it live!
In the above code we have:
- Set the height of the HTML <body> to 100% using CSS ( style="height:100%;" )
- Set the height of the container DIV to 100%, which means that it will vertically fill up whole space of its parent element (which is the HTML body). It is not required to specify the DIV's width, since by default it takes up the full width.
- Set the chart's width and height to 100%
- Set manageResize='1' in the <chart> element of the XML data