FusionWidgets XT allows you to export data from your charts in CSV format. The export of data can be triggered in two ways:
- For Flash charts, using the context menu of chart. In this method, the generated CSV data is copied to clipboard. This is not supported in JavaScript charts
- Using JavaScript API (getDataAsCSV) for data export.In this method, the CSV data is returned as string in your JavaScript code
Let's study both of them one by one.
To allow export of data using context menu, you need to specify the following in data:
<chart showExportDataMenuItem='1' caption='Top 5 Sales Person' numberPrefix='$' isSliced='1'>
     <set label='Alex' value='25000'  />
     <set label='Mark' value='35000' />
     <set label='David' value='42300' />
     <set label='Graham' value='65300' />
     <set label='John' value='91300' />
  </chart>
{
"chart":{
"showexportdatamenuitem":"1",
"caption":"Top 5 Sales Person",
"numberprefix":"$",
"issliced": "1"
},
"data":[
{ "label":"Alex", "value":"25000" },
{ "label":"Mark", "value":"35000" },
{ "label":"David", "value":"42300" },
{ "label":"Graham", "value":"65300" },
{ "label":"John", "value":"91300" }
]
}
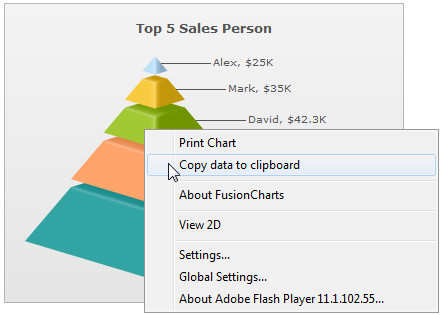
As soon as showExportDataMenuItem='1' is set in the chart, a new item is added to the chart's context menu, as shown below:
See a live sample!
The label of this menu item can be customized by setting:
When you select this item, the data of this chart will be copied to your clipboard. If you open any text editor and paste the content of the clipboard, you'll get something as under:
"Label","Value"
"Alex","25000"
"Mark","35000"
"David","42300"
"Graham","65300"
"John","91300"
This is basically the CSV representation of your chart's data. Let us next see how to format the CSV data output using various export related XML attributes that FusionWidgets XT exposes.
You can customize the following aspects of the output CSV data:
- The separator character to be used for data. By default this is CSV.
- The qualifier character to be used. By default this is double quotes.
- Whether to output formatted data values (as shown on chart) in CSV, or raw values.
The following attributes help in configuring this:
| Attribute | Description | Example |
| exportDataSeparator | Lets you set the separator for CSV data. For ease of use, this attribute accepts the following pseudo codes for characters:
You can also specify any other character apart from these pseudo codes. |
exportDataSeparator='{tab}' |
| exportDataQualifier | Lets you set the qualifier character for CSV data. For ease of use, this attribute accepts the following pseudo codes for characters:
You can also specify any other character apart from these pseudo codes. |
exportDataQualifier='{quot}' |
| exportDataFormattedVal | Boolean value indicating whether to output formatted data values (as shown on chart) in the output CSV. | exportDataFormattedVal='1' |
In the next section, we'll see how to access this data using JavaScript API.