<map borderColor='005879' fillColor='D7F4FF' includeValueInLabels='1' numberPrefix='$' baseFontSize='9'>
<data>
<entity id="NA" value="6921900" link='newchart:FCMap_NorthAmerica.swf-xmlurl-NorthAmerica.xml' />
<entity id="SA" value="3087120" link='newchart:FCMap_SouthAmerica.swf-xmlurl-SouthAmerica.xml' />
<entity id="AS" value="2434120" link='newchart:FCMap_Asia-xmlurl.swf-Asia.xml' />
<entity id="EU" value="5093230" link='newchart:FCMap_Europe.swf-xmlurl-Europe.xml' />
<entity id="AF" value="1032900" link='newchart:FCMap_Africa.swf-xmlurl-Africa.xml' />
<entity id="AU" value="3461230" link='newchart:FCMap_Australia.swf-xmlurl-Australia.xml' />
</data>
</map>
LinkedCharts is a new and smart drill-down feature introduced in FusionMaps XT that allows you to create unlimited level of drill-down maps using a single data source. All the links originate from a parent map and its data, which comprehensively contains XML/JSON data or Data URL for all descendant (child, grand-child) maps. Upon clicking the entity items of the parent map or clicking the parent map itself, users can drill-down into descendant maps. The descendant maps (or children maps) can either replace the parent map with an option to drill-up, or can be opened in new dialogs or frames.
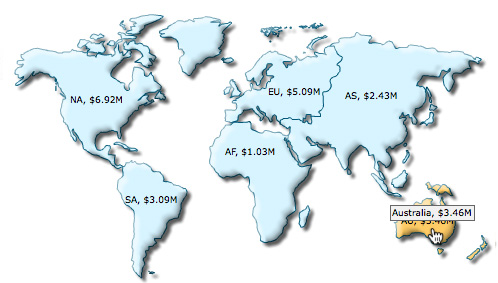
Let's consider a simple scenario with a single level of drill-down. There is a parent map which is a world map that shows sales of a product in each continent, which when clicked will render map of respective continents. Let's build the parent map as a World Map with continents. LinkedCharts allows you to build these kind of scenarios (and much more complex) without having to write any additional line of code.
To use LinkedCharts, you need to follow these steps:
- First, create the XML/JSON data for parent map . This is called the parent map source and comprehensively contains Data String or Data URL for all descendant maps.
- Next, append the Data String or Data URL for all the descendant maps (also called child map) within the parent data source. If Data String method is used, data for each descendant map is embedded within the parent data source and linked using unique data identifiers.
You're done. Yes, no additional code is required!
The LinkedChart feature of FusionCharts JavaScript Class will take care of the rest. It does the following:
- Automatically creates and shows a detailed child map when an entity item link » (specially defined links using newchart prefix) in the parent map is clicked
- Clones all map configuration settings from the parent map to create the child map or the LinkedChart
- Allows you to configure specific properties for the descendant maps » e.g., type of map, width, height, where the maps will be shown etc. using configureLink() function
- Notifies your code by way of events whenever a link is invoked, link item is opened and link item is closed
- Allows you to drill-down to unlimited numbers of levels
The images below shows how a simple LinkedCharts implementation works (here, we've shown only 1 level of drill-down):
 |
 |
| Parent map when the continent Australia is clicked | LinkedChart displaying Australia map |
See it live!
In this page, we will learn LinkedCharts by doing the following:
- Create a basic LinkedChart which loads descendant (child) maps replacing the parent map. The data of the child maps will be specified as Data URL
- Create LinkedCharts with data for all child maps specified as Data String (embedded inside the parent map data source)
- Change configuration of descendent maps at different levels of drill-down ( here, we will change the map type of the descendant maps)
- Open LinkedCharts in a separate HTML container
Let's straight jump into code and see how LinkedCharts work.
HTML
Let's see the code for a simple LinkedChart that renders a world map with links:
<html>
  <head>
    <title>My First map using LinkedCharts feature</title>
    <script type="text/javascript" src="Maps/FusionCharts.js"></script>
  </head>
  <body>
    <div id="mapContainer">FusionMaps XT will load here!</div>
    <script type="text/javascript"><!--

      var myMap = new FusionCharts ("Maps/FCMap_World.swf", "MyMapId", "700", "400", "0");
      myMap.setXMLUrl ("Linked-Data.xml");
      myMap.render("mapContainer");
    // -->
    </script>
  </body>
</html>
In the above HTML we have created only the parent map. The map takes data from an xml file, Linked-Data.xml. This map, in junction with LinkedCharts functionality defined in FusionCharts.js, will drive drill-down maps; without you having to write any additional line of code.
Data
The XML/JSON data is what drives the entire LinkedCharts drill-down functionality. In this example, we will use Data URL method to specify URL of descendant maps. In context of XML data, it is xmlurl data format. For JSON, it is jsonurl. Given below is the XML/JSON data specifying LinkedChart for each continent.
{
  "map": {
    "bordercolor": "005879",
    "fillcolor": "D7F4FF",
    "numberPrefix": "$",
    "includevalueinlabels": "1",
    "basefontsize": "9"
  },
  "data": [
    {
      "id": "NA",
      "value": "6921900",
      "link": "newchart:FCMap_NorthAmerica.swf-jsonurl-NorthAmerica.json"
    },
    {
      "id": "SA",
      "value": "3087120",
      "link": "newchart:FCMap_SouthAmerica.swf-jsonurl-SouthAmerica.json"
    },
    {
      "id": "AS",
      "value": "2434120",
      "link": "newchart:FCMap_Asia.swf-jsonurl-Asia.json"
    },
    {
      "id": "EU",
      "value": "5093230",
      "link": "newchart:FCMap_Europe.swf-jsonurl-Europe.json"
    },
    {
      "id": "AF",
      "value": "1032900",
      "link": "newchart:FCMap_Africa.swf-jsonurl-Africa.json"
    },
    {
      "id": "AU",
      "value": "3461230",
      "link": "newchart:FCMap_Australia.swf-jsonurl-Australia.json"
    }
  ]
}
In the above data we define link attribute for each entity element. Note how link for each continent is defined as newchart:FCMap_NorthAmerica.swf-xmlurl-NorthAmerica.xml. The link can be broken down into:
- newChart prefix: used to indicate that it must invoke LinkedChart.
- The type of map or the name of the map SWF file is added separated by a colon (:).
- xmlurl indicates that URL method is used to specify data for linked map; in case of JSON data, jsonurl is used.
- NorthAmerica.xml is the URL specifying the data path for the linked map that opens when this entity is clicked.
Note: You can create LinkedCharts using the link attribute or the clickURL attribute of the map.
As per the above XML, the data for the North America child maps is NorthAmerica.xml; for South America it is SouthAmerica.xml etc. As per the above JSON, the data for the North America child maps is NorthAmerica.json; for South America it is SouthAmerica.json and so on.
The XML/JSON for a child map (say, Australia) is as follows:
Note: Considering the data format for the child maps are same, here we will show data for only Australia. In actual implementation, data will be required for all the continent maps.
<map borderColor='005879' fillColor='D7F4FF' includeValueInLabels='1' numberPrefix='$' baseFontSize='9' >
      <data>
          <entity id='WA'  value="200050" />
          <entity id='NT'  value="1509800" />
          <entity id='QU'  value="8034800" />
          <entity id='SA'  value="123000" />
          <entity id='SW'  value="548000" />
          <entity id='VI'  value="182000" />
          <entity id='TA'  value="94900" />
     </data>
</map>
     {
        "map": {
          "bordercolor": "005879",
          "fillcolor": "D7F4FF",
          "includevalueinlabels": "1",
          "numberprefix": "$",
          "basefontsize": "9"
        },
        "data": [
          {
            "data": [
              {
                "id": "WA",
                "value": "200050"
              },
              {
                "id": "NT",
                "value": "1509800"
              },
              {
                "id": "QU",
                "value": "8034800"
              },
              {
                "id": "SA",
                "value": "123000"
              },
              {
                "id": "SW",
                "value": "548000"
              },
              {
                "id": "VI",
                "value": "182000"
              },
              {
                "id": "TA",
                "value": "94900"
              }
            ]
          }
        ]
      }
The page first loads the parent map, a World Map. When a continent is clicked the parent map is replaced by a detailed child map of that continent. There is a Back overlay button at the top right corner of the map. This button when clicked leads us back to the main map.
This is a very basic sample in which the parent map is replaced by the child map. However, there are a lot of things that you can configure, like:
- Make the descendant maps open in a separate container.
- Extend the functionality to open the descendant maps in jQuery dialogs, light-boxes etc. using event listeners.
- Modify various aspects (like size, attribute etc.) of the parent and descendent maps.
Possibilities are endless. We will explore some of the possibilities in the coming sections of this page.
Pointers on the XML's link attribute to implement LinkedCharts :
The format of the link attribute's value is - "newchart:mapSWFname-dataformat-datasource". The format is explained below:
- Each link starts with a constant, newchart to declare that the link will invoke LinkedCharts
- newchart is followed by a colon (:) and then the SWF filename of the child map is specified. If you are rendering only JavaScript maps, you can provide JavaScript map alias instead.
Note: Do not set the complete path of the map SWF file here. FusionCharts JavaScript Class is smart enough to pick it up from the path of the parent map. However, if required, you can also configure the path of the child map SWF files - which we will soon see.
- dataformat » ( i.e., value after newchart prefix and a hyphen (-) ) is the format in which data for the child map is provided. Data format can be of 4 types:
- xmlurl - This defines that the data for the new map will come from an XML URL. This is automatically loaded by the child map
- jsonurl - This defines that the data for the new map will come from a JSON URL. This is automatically loaded by the child map
- xml - This defines that the data for the new map will come from XML embedded inside the XML for the parent map (parent data source)
- json - This defines that the data for the new map will come from JSON embedded inside the JSON for the parent map (parent data source)
- datasource » (the rest of the value, after a hyphen (-) again) defines the value for data source (either URL or Data String itself) for the descendant map as per the dataformat set:
- When xmlurl is set as the dataformat, the datasource value will be a URL of the XML file
- When jsonurl is set as the dataformat, the datasource value will be a URL of the JSON file
- When xml is set as the dataformat, the datasource assumes value of the unique data identifier which refers to data embedded inside <linkeddata> node (that contains data for all descendant maps) in the parent data source for the descendant map
- When json is set as the dataformat, the datasource assumes value of the unique data identifier which refers to data embedded inside the Array linkeddata (that contains data for all descendant maps) in the parent data source for the descendant map
You can embed the descendant Data String in the parent data source. This is called Data String method in context of LinkedCharts. Each entity item in parent map is then linked to a descendant map data (embedded in parent data source) by means of a unique data identifier. A sample XML and equivalent JSON is given below:
Note: To make the sample data light weight for this demonstration, we have placed data for only Australia map. In actual implementation, data will be required.
<map borderColor='005879' fillColor='D7F4FF' includeValueInLabels='1' numberPrefix='$' baseFontSize='9'>

      <data>
        <entity id="NA" value="6921900" link='newchart:FCMap_NorthAmerica.swf-xml-NorthAmerica' />
        <entity id="SA" value="3087120" link='newchart:FCMap_SouthAmerica.swf-xml-SouthAmerica' />
        <entity id="AS" value="2434120" link='newchart:FCMap_Asia.swf-xml-Asia' />
        <entity id="EU" value="5093230" link='newchart:FCMap_Europe.swf-xml-Europe' />
        <entity id="AF" value="1032900" link='newchart:FCMap_Africa.swf-xml-Africa' />
        <entity id="AU" value="3461230" link='newchart:FCMap_Australia.swf-xml-Australia' />
      </data>

     <linkeddata id="Australia">
      <map borderColor='005879' fillColor='D7F4FF' includeValueInLabels='1' numberPrefix='$' baseFontSize='9' >
			<data>
                <entity id='WA'  value="200050" />
                <entity id='NT'  value="1509800" />
                <entity id='QU'  value="8034800" />
                <entity id='SA'  value="123000" />
                <entity id='SW'  value="548000" />
                <entity id='VI'  value="182000" />
                <entity id='TA'  value="94900" />
        </data>
    </map>
  </linkeddata>

  <linkeddata id="NorthAmerica">
    <map borderColor='005879' fillColor='D7F4FF' includeValueInLabels='1' numberPrefix='$' baseFontSize='9' >
    </map>
  </linkeddata>
  <linkeddata id="SouthAmerica">
  <map borderColor='005879' fillColor='D7F4FF' includeValueInLabels='1' numberPrefix='$' baseFontSize='9' >
</map>
  </linkeddata>
  <linkeddata id="Europe">
  <map borderColor='005879' fillColor='D7F4FF' includeValueInLabels='1' numberPrefix='$' baseFontSize='9' >
</map>
  </linkeddata>
  <linkeddata id="Africa">
  <map borderColor='005879' fillColor='D7F4FF' includeValueInLabels='1' numberPrefix='$' baseFontSize='9' >
</map>
  </linkeddata>
</map>
{
  "map": {
    "bordercolor": "005879",
    "fillcolor": "D7F4FF",
    "includevalueinlabels": "1",
    "numberprefix": "$",
    "basefontsize": "9"
  },
  "data": [
    {
      "id": "NA",
      "value": "6921900",
      "link": "newchart:FCMap_NorthAmerica.swf-json-NorthAmerica"
    },
    {
      "id": "SA",
      "value": "3087120",
      "link": "newchart:FCMap_SouthAmerica.swf-json-SouthAmerica"
    },
    {
      "id": "AS",
      "value": "2434120",
      "link": "newchart:FCMap_Asia.swf-json-Asia"
    },
    {
      "id": "EU",
      "value": "5093230",
      "link": "newchart:FCMap_Europe.swf-json-Europe"
    },
    {
      "id": "AF",
      "value": "1032900",
      "link": "newchart:FCMap_Africa.swf-json-Africa"
    },
    {
      "id": "AU",
      "value": "3461230",
      "link": "newchart:FCMap_Australia.swf-json-Australia"
    }
  ],
  "linkeddata": [
    {
      "id": "Australia",
      "linkedmap": {
        "map": {
          "bordercolor": "005879",
          "fillcolor": "D7F4FF",
          "includevalueinlabels": "1",
          "numberprefix": "$",
          "basefontsize": "9"
        },
        "data": [
              {
                "id": "WA",
                "value": "200050"
              },
              {
                "id": "NT",
                "value": "1509800"
              },
              {
                "id": "QU",
                "value": "8034800"
              },
              {
                "id": "SA",
                "value": "123000"
              },
              {
                "id": "SW",
                "value": "548000"
              },
              {
                "id": "VI",
                "value": "182000"
              },
              {
                "id": "TA",
                "value": "94900"
              }
          ]
      }
    },
    {
      "id": "NorthAmerica",
      "linkedmap": {
        "map": {
          "bordercolor": "005879",
          "fillcolor": "D7F4FF",
          "includevalueinlabels": "1",
          "numberprefix": "$",
          "basefontsize": "9"
        }
      }
    },
    {
      "id": "SouthAmerica",
      "linkedmap": {
        "map": {
          "bordercolor": "005879",
          "fillcolor": "D7F4FF",
          "includevalueinlabels": "1",
          "numberprefix": "$",
          "basefontsize": "9"
        }
      }
    },
    {
      "id": "Asia",
      "linkedmap": {
        "map": {
          "bordercolor": "005879",
          "fillcolor": "D7F4FF",
          "includevalueinlabels": "1",
          "numberprefix": "$",
          "basefontsize": "9"
        }
      }
    },
    {
      "id": "Europe",
      "linkedmap": {
        "map": {
          "bordercolor": "005879",
          "fillcolor": "D7F4FF",
          "includevalueinlabels": "1",
          "numberprefix": "$",
          "basefontsize": "9"
        }
      }
    },
    {
      "id": "Africa",
      "linkedmap": {
        "map": {
          "bordercolor": "005879",
          "fillcolor": "D7F4FF",
          "includevalueinlabels": "1",
          "numberprefix": "$",
          "basefontsize": "9"
        }
      }
    }
  ]
}
For detailed information of the XML/JSON structure of the LinkedCharts' data read Drill-Down maps > LinkedCharts > XML Format and JSON Format pages.
Till now, we've seen how to use the standard LinkedCharts feature provided by FusionMaps XT. Here, the descendant maps used the same configuration as parent map. However, FusionCharts JavaScript Class allows you to configure each aspect of the descendant maps LinkedCharts using the function configureLink() for each map instance. Using this function, you can pass all your desired configurations for the descendant maps as stated below:
- You can pass all the properties that a FusionCharts constructor accepts.
- You can also configure the overlay button (the "Back" button on the to-right corner of the child map) using overlayButton property.
- You can specify the path of child map SWF or JavaScript files (in case you keep map files in different folders)
In the sample JavaScript code given below, we will set custom colors for overlay-buttons. Note that for this example we will use the same data files that we have used in our basic LinkedChart sample above.
The images below shows how it works:
|
 |
See it live!
var myMap = new FusionCharts( "Maps/FCMap_World.swf",
    "myMapId", "320", "250", "0", "1" );
  myMap.setXMLUrl("LinkedMap.xml");
  myMap.render("MapContainer");

  FusionCharts("myMapId").configureLink (
  {
    overlayButton:
    {
      message: 'close',
      fontColor : '880000',
      bgColor:'FFEEEE',
      borderColor: '660000'
    }
  }, 0);
In the above code we've done the following:
- Created a parent map with ID myMapId. We've provided it the XML data that we had built earlier.
- Called configureLink function to configure the descendant maps.
- Two parameters are passed to this function:
- The first parameter contains another property, overlayButton to configure overlay button.
- Passed the drill-down level to configure as the second parameter of the function (zero here). Zero denotes the first level of drill-down. The level value keeps increasing by one for subsequent levels of drill-down.
Note that you can pass all the properties that a FusionCharts constructor accepts as the property of the parameter of configureLink function. To know the properties for overlayButton read overlayButton property list.
Now let's modify the above code and the HTML a bit so that we can render the descendant maps in a separate HTML container. This will help us retain the parent map as well as show the child maps separately. The changes are as follows:
In the HTML we added a new DIV with "linkedchart-container" as id just below the existing map container DIV. This new DIV will be the container for the descendant maps .
<div id="mapContainer">Parent maps will load here</div>

<div id="linkedchart-container" >Click on a continent to show detailed map.</div>
FusionCharts("myMapId").configureLink (
  {
    "renderAt" : "linkedchart-container",
    overlayButton: { show : false }
  }, 0 );
In JavaScript's configureLink function we do a bit of modifications as described below:
- We add renderAt property and set the value to "linkedchart-container" where the LinkedCharts will be generated
- We set the overlay button off by setting the show property to false
Once run, the world map renders first.
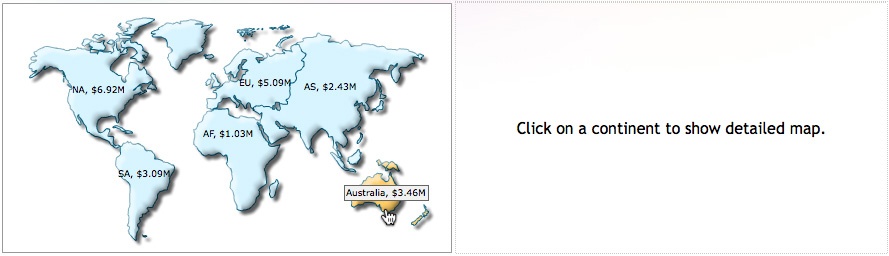
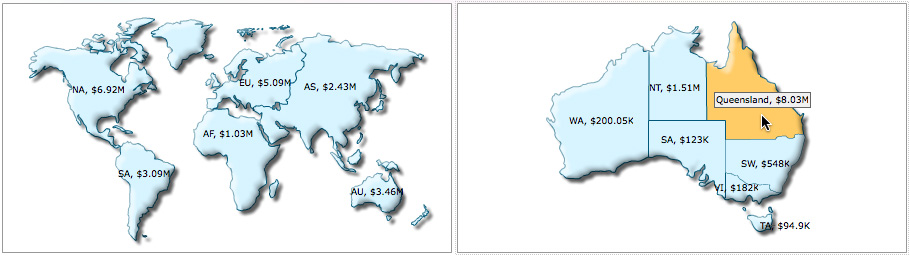
When a continent is clicked, the child continent map is rendered in the 'linkedchart-container' DIV as show in the image below:
By default, the child map file (Flash SWF file) loads from the same location where the parent map file resides. However, you may have a requirement to put map files in separate folders. For instance, you group map files based on hierarchy and have folders like "world', "continent", "county", "state" etc. Here, we we will see how to configure LinkedCharts to open child maps from a different folder. Consider the scenario where the map SWF file of the child map is located in a different folder from that of the parent map. For example, the name of the folder where the SWF files of the child maps are located is "Continent". In that case you need to specify the relative path of the child map within the configureLink() function through the swfSrcPath property.. The configuration is shown in the code below:
FusionCharts("myMapId").configureLink (
  {
    "swfSrcPath" : "Continent/"
  }, 0 );
Note: The path should be relative to the HTML or the web page.