Using FusionCharts PHP Class > Basic Examples
FusionCharts can effectively be used with PHP to plot dynamic data-driven charts. With FusionCharts PHP Class chart rendering becomes even easier. Let's see how to make use of FusionCharts PHP Class functions and create charts in few easy steps.
We'll cover the following examples here:
- Creating a simple chart using FusionCharts PHP Class
- Creating a chart with external XML file created using FusionCharts PHP Class
Let's quickly see each of them. Before you proceed with the contents in this page, we strictly recommend you to please go through the section "How FusionCharts works?".
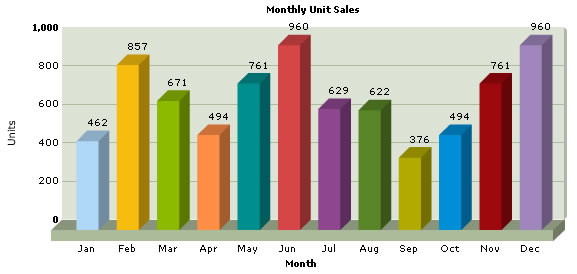
Let's now get to building our first chart. In this example, we'll create a "Monthly Unit Sales" chart.
<?php
//We've included ../Includes/FusionCharts_Gen.php, which contains FusionCharts PHP Class
//to help us easily embed the charts.
include("../Includes/FusionCharts_Gen.php");
?>
<HTML>
<HEAD>
<TITLE>
FusionCharts Free - Simple Column 3D Chart
</TITLE>
<?php
//You need to include the following JS file, if you intend to embed the chart using JavaScript.
//Embedding using JavaScripts avoids the "Click to Activate..." issue in Internet Explorer
//When you make your own charts, make sure that the path to this JS file is correct.
//Else, you would get JavaScript errors.
?>
<SCRIPT LANGUAGE="Javascript" SRC="../../FusionCharts/FusionCharts.js"></SCRIPT>
</HEAD>
<BODY>
<?php
//This page demonstrates the ease of generating charts using FusionCharts PHP Class.
//For this chart, we've created an instance of FusionCharts PHP Class,
//fed chart data and configuration parameters to it and rendered chart using the instance.
//Here, we've kept this example very simple.
# Create object for Column 3D chart
$FC = new FusionCharts("Column3D","600","300");
# Setting Relative Path of chart swf file.
$FC->setSwfPath("../../FusionCharts/");
# Store chart attributes in a variable
$strParam="caption=Monthly Unit Sales;xAxisName=Month;yAxisName=Units;decimalPrecision=0; formatNumberScale=0";
# Set chart attributes
$FC->setChartParams($strParam);
# Add chart data along with category names
$FC->addChartData("462","name=Jan");
$FC->addChartData("857","name=Feb");
$FC->addChartData("671","name=Mar");
$FC->addChartData("494","name=Apr");
$FC->addChartData("761","name=May");
$FC->addChartData("960","name=Jun");
$FC->addChartData("629","name=Jul");
$FC->addChartData("622","name=Aug");
$FC->addChartData("376","name=Sep");
$FC->addChartData("494","name=Oct");
$FC->addChartData("761","name=Nov");
$FC->addChartData("960","name=Dec");
# Render chart
$FC->renderChart();
?>
</BODY>
</HTML>
- Included FusionCharts_Gen.php class and FusionCharts.js class
- Created FusionCharts PHP class object $FC for a Column 3D chart with 600 pixels width and 300 pixels height
- Set relative path of chart SWF file using setSwfPath
- Stored delimiter separated chart attributes in a variable $strParam
- Set these chart attributes to our chart using setChartParams
- Added chart values and category names that are to be plotted on the Column 3D chart
- Finally rendered the chart using renderChart
When you now run this page, you'll see a chart like the one below.
If you do not see a chart like the one below, please follow the steps listed in Debugging your Charts section of this documentation.
<?php
//We've included ../../Includes/FusionCharts_Gen.php - FusionCharts PHP Class
//to help us easily embed the charts.
include("../../Includes/FusionCharts_Gen.php");
?>
<?php
//This page demonstrates the ease of generating charts using FusionCharts PHPClass.
//We create a FusionCharts object instance
//Set chart values and configurations and retunns the XML using getXML() funciton
//and write it to the response stream to build the XML
//Here, we've kept this example very simple.
# Create a column 3d chart object
$FC = new FusionCharts("column3D","600","300");
# Set Relative Path of chart swf file.
$FC->setSwfPath("../../FusionCharts/");
# Store Chart attributes in a variable
$strParam="caption=Monthly Unit Sales;xAxisName=Month;yAxisName=Units;decimalPrecision=0; formatNumberScale=0;showNames=1";
# Set chart attributes
$FC->setChartParams($strParam);
# Add chart data values and category names
$FC->addChartData("462","name=Jan");
$FC->addChartData("857","name=Feb");
$FC->addChartData("671","name=Mar");
$FC->addChartData("494","name=Apr");
$FC->addChartData("761","name=May");
$FC->addChartData("960","name=Jun");
$FC->addChartData("629","name=Jul");
$FC->addChartData("622","name=Aug");
$FC->addChartData("376","name=Sep");
$FC->addChartData("494","name=Oct");
$FC->addChartData("761","name=Nov");
$FC->addChartData("960","name=Dec");
# Get the chart XML
$strXML=$FC->getXML();
// Set content type as XML
header('Content-type: text/xml');
# Return the chart XML for Column 3D Chart
print $strXML;
?>
- Included FusionCharts_Gen.php class and FusionCharts.js class
- Created FusionCharts PHP class object $FC for a Column 3D chart with 600 pixels width and 300 pixels height
- Set relative path of chart SWF file
- Stored delimiter separated chart attributes in a variable $strParam
- Set these chart attributes to our chart
- Added chart data that are to be plotted on the Column 3D chart
- Finally returned the XML and wrote it to the response stream
<?php
//We've included ../Includes/FusionCharts.php, which contains functions
//to help us easily embed the charts.
include("../Includes/FusionCharts.php");
?>
<HTML>
<HEAD>
<TITLE>
FusionCharts Free - Simple Column 3D Chart using dataURL method
</TITLE>
<?php
//You need to include the following JS file, if you intend to embed the chart using JavaScript.
//Embedding using JavaScripts avoids the "Click to Activate..." issue in Internet Explorer
//When you make your own charts, make sure that the path to this JS file is correct. Else, you
//would get JavaScript errors.
?>
<SCRIPT LANGUAGE="Javascript" SRC="../../FusionCharts/FusionCharts.js"></SCRIPT>
</HEAD>
<BODY>
<?php
//For this chart, we've used a Data.php which uses FusionCharts PHP Class (contained in /Data/ //folder)
//Data.php generates the chart XML and pass it this file
//We will use FusionCharts PHP chart embedding function - renderChart() to render the chart
//For a head-start, we've kept this example very simple.
//Create the chart - Column 3D Chart with data from Data/Data.php
echo renderChart("../../FusionCharts/FCF_Column3D.swf", "Data/Data.php", "", "myFirst", 600, 300, false, false);
?>
</BODY>
</HTML>
- Include FusionCharts.php and FusionCharts.js class
- Call renderChart() function with data from Data.php function.