FusionCharts for Flex > Your First Widget > Adding Annotations
FusionCharts for Flex let's you create your own custom visual objects (shapes, images, text etc.) and use them as annotations for your widget. You can create various shapes like polygons, rectangles, circles, arcs etc, render annotation text at required positions and load external GIF/JPEG/PNG images or other Flash movies in the widget. Annotations can be used to highlight special areas of your widget or simply to spruce up its appearance.
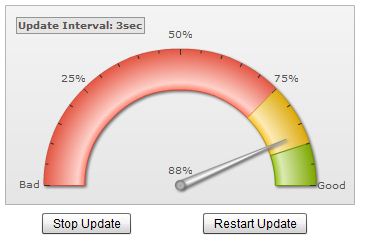
We will add a text annotation to our existing gauge in order to state our update interval time:
<annotations>
  <annotationGroup id='Grp1' >
     <annotation type='text' x='75' y='20'
        label='Update Interval: 3sec'
        fontColor='555555' bold='1'
        bgColor='e7e4e4' borderColor='8f979b' />
  </annotationGroup>
</annotations>
Observe, that in the code we:
- Create an annotation group. We can create any number of annotation groups and each group can contain any number of annotations.
- Here we define a simple text annotation. This is done by seting the type of annotation using attribute type='text'.
- Now, we declare x, y attributes to properly position the annotation.
- The text label is where we actually define the text content of the annotation.
- We stylize the font using the fontColor and the bold attribute.
- Finally, we set on the border using borderColor, and the background using the bgColor attribute.
The XML code for the annotation must be placed as a child element of the <chart> element of the widget's XML. After adding the above code to the exsiting Data.xml, it should look as follows:
<chart lowerLimit='0' upperLimit='100' lowerLimitDisplay='Bad'  upperLimitDisplay='Good'
  numberSuffix='%' showValue='1'
  dataStreamURL='http://www.fusioncharts.com/demos/gallery/DataProviders/Cylinder.asp'
  refreshInterval='3'
 >
  <colorRange>
      <color minValue='0'  maxValue='75'  code='FF654F'/>
      <color minValue='75' maxValue='90'  code='F6BD0F'/>
      <color minValue='90' maxValue='100' code='8BBA00'/>
   </colorRange>
   <dials>
      <dial value='92'/>
   </dials>

   <annotations>
      <annotationGroup id='Grp1' >
         <annotation type='text' x='75' y='20'
            label='Update Interval: 3sec'
         	fontColor='555555' bold='1'
         	bgColor='e7e4e4' borderColor='8f979b' />
      </annotationGroup>
   </annotations>
</chart>
Your new MXML application should look like this:
Please refer to FusionWidgets and XML > Annotation section to get detailed information on Annotations.