| Object Name |
Description |
Features Supported |
Animation Parameters Supported |
| ANCHORS |
On line/area charts, ANCHORS (or marker points) are polygons which appear at the joint of two consecutive lines/area points. These are indicators to show the position of data points. The anchors handle tool tips and links for the data points. |
Animation
Shadow
Glow
Bevel
Blur
|
_alpha
_x
_y
_xScale
_yScale
|
| BACKGROUND |
BACKGROUND refers to the entire background of the chart. |
Animation
Shadow
Glow
Bevel
Blur
|
_alpha
_x
_y
_xScale
_yScale
|
| CAPTION |
CAPTION refers to the heading of the chart. |
Animation
Font
Shadow
Glow
Bevel
Blur
|
_alpha
_x
_y
|
| DATALABELS |
DATALABELS refer to the x-axis labels of the data. |
Animation
Font
Shadow
Glow
Bevel
Blur
|
_alpha
_x
_y
|
| DATAPLOT |
DATAPLOT refers to the actual plot of the chart. For example, in Column 2D chart, columns are referred to as DATAPLOT. In Pie chart, it's the pies. In Bubble chart, it's the bubbles and so on. |
Animation
Shadow
Glow
Bevel
Blur
|
_alpha
_x
_y
_xScale
_yScale
|
| DATAVALUES |
DATAVALUES refer to the plot values i.e., value of each data (line, column, bar, pie etc.), which is displayed beside the data plot. |
Animation
Font
Shadow
Glow
Bevel
Blur
|
_alpha
_x
_y
|
| LEGEND |
LEGEND is the object in which the series names of all data-sets show up. |
Animation
Font
Shadow
Glow
Bevel
Blur
|
_alpha
|
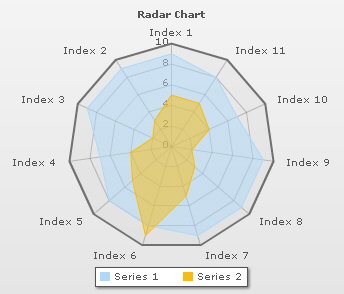
| RADAR |
RADAR refers to the outer radar drawing over which the plot is drawn. |
Animation
Shadow
Glow
Bevel
Blur
|
_alpha
_x
_y
_xScale
_yScale
|
| SUBCAPTION |
SUBCAPTION refers to the sub-heading of the chart. |
Animation
Font
Shadow
Glow
Bevel
Blur
|
_alpha
_x
_y
|
| TOOLTIP |
TOOLTIP refers to the tool tip shown when mouse is hovered over the data plots. |
Font
|
|
| YAXISVALUES |
YAXISVALUES refers to the limit values or divisional line values, which are displayed along the y-axis of the chart. |
Animation
Font
Shadow
Glow
Bevel
Blur
|
_alpha
_x
_y
|
 |
| animation |
Boolean |
0/1 |
This attribute lets you set the configuration whether the chart should appear in an animated fashion. If you do not want to animate any part of the chart, set this as 0. |
| palette |
Number |
1-5 |
FusionCharts introduces the concept of Color Palettes. Each chart has 5 pre-defined color palettes which you can choose from. Each palette renders the chart in a different color theme. Valid values are 1-5. |
| paletteColors |
String |
List of hex color codes separated by comma |
While the palette attribute allows to select a palette theme that applies to chart background, canvas, font and tool-tips, it does not change the colors of data items (i.e., column, line, pie etc.). Using paletteColors attribute, you can specify your custom list of hex colors for the data items. The list of colors have to be separated by comma e.g., <chart paletteColors='FF0000,0372AB,FF5904...'>. The chart will cycle through the list of specified colors and then render the data plot accordingly.
To use the same set of colors throughout all your charts in a web application, you can store the list of palette colors in your application globally and then provide the same in each chart XML. |
| showAboutMenuItem |
Boolean |
0/1 |
Setting this to 1 shows up a custom context menu in the chart, which can be customized to show your text and can be linked to your URL. For e.g., you can set the context menu of the chart to include "About your company name" and then link to your company home page. By default, the chart shows "About FusionCharts" when right clicked. |
| aboutMenuItemLabel |
String |
|
The menu item label for the custom context menu item. |
| aboutMenuItemLink |
String |
URL |
Link for the custom context menu item. You can specify the link in FusionCharts link format to be able to open the same in new window, pop-ups, frames or as JavaScript links. |
| showLabels |
Boolean |
0/1 |
It sets the configuration whether the x-axis labels will be displayed or not. |
| labelStep |
Number |
1 or above |
By default, all the labels are displayed on the chart. However, if you've a set of streaming data (like name of months or days of week), you can opt to hide every n-th label for better clarity. This attributes just lets you do so. It allows to skip every n(th) X-axis label. |
| showValues |
Boolean |
0/1 |
Sets the configuration whether data values would be displayed along with the data plot on chart. |
| showYAxisValues |
Boolean |
0/1 |
FusionCharts y-axis is divided into vertical sections using div (divisional) lines. Each div line assumes a value based on its position. Using this attribute you can set whether to show those div line (y-axis) values or not. |
|
showLimits |
Boolean |
0/1 |
Whether to show chart limit values. showYAxisValues is the single new attribute in which over-rides this value. |
|
showDivLineValues |
Boolean |
0/1 |
Whether to show div line values. showYAxisValues is the single new attribute in which over-rides this value. |
| yAxisValuesStep |
Number |
1 or above |
By default, all div lines show their values. However, you can opt to skip every x(th) div line value using this attribute. |
| adjustDiv |
Boolean |
0/1 |
FusionCharts automatically tries to adjust divisional lines and limit values based on the data provided. However, if you want to set your explicit lower and upper limit values and number of divisional lines, first set this attribute to false. That would disable automatic adjustment of divisional lines. |
| showPrintMenuItem |
Boolean |
0/1 |
When you write click on the chart it shows a context menu. This attribute allows you to show or hide the "Print" option in the context menu. |
| showTooltipforWrappedLabels |
Boolean |
0/1 |
When the labels of the chart are too lengthy, the chart truncates them and displays a part of the label. In this situation, this attribute shows a tooltip displaying the complete label when the mouse is hovered on the shortened labels. |
|
unescapeLinks |
Boolean |
0/1 |
Internally the chart decodes a Url that you set as link. Before invoking the link it again encodes the Url. If you are passing multilingual characters via a Url or do not want this decode-encode mechanism to be handled by chart you can set,unescapeLinks='0'. |
| showZeroPlaneValue |
Boolean |
0/1 |
Allows you to show or hide the value of the zero plane. |
| clickURL |
String |
|
The entire chart can now act as a hotspot. Use this URL to define the hotspot link for the chart. The link can be specified in FusionCharts Link Format. |
| defaultAnimation |
Boolean |
0/1 |
By default, each chart animates some of its elements. If you wish to switch off the default animation patterns, you can set this attribute to 0. It can be particularly useful when you want to define your own animation patterns using STYLE feature. |
| yAxisMinValue |
Number |
|
This attribute helps you explicitly set the lower limit of the chart. If you don't specify this value, it is automatically calculated by FusionCharts based on the data provided by you. |
| yAxisMaxValue |
Number |
|
This attribute helps you explicitly set the upper limit of the chart. If you don't specify this value, it is automatically calculated by FusionCharts based on the data provided by you. |
| radarRadius |
Number |
In Pixels |
If you want to explicitly specify a radius for the radar chart, use this attribute. Otherwise, FusionCharts will automatically calculate the best-fit radius. |
| setAdaptiveYMin |
Boolean |
0/1 |
This attribute lets you set whether the y-axis lower limit would be 0 (in case of all positive values on chart) or should the y-axis lower limit adapt itself to a different figure based on values provided to the chart. |
| showBorder |
Boolean |
0/1 |
Whether to show a border around the chart or not? |
| borderColor |
Color |
|
Border color of the chart. |
| borderThickness |
Number |
In Pixels |
Border thickness of the chart. |
| borderAlpha |
Number |
0-100 |
Border alpha of the chart. |
| bgColor |
Color |
|
This attribute sets the background color for the chart. You can set any hex color code as the value of this attribute. To specify a gradient as background color, separate the hex color codes of each color in the gradient using comma. Example: FF5904,FFFFFF. Remember to remove # and any spaces in between. See the gradient specification page for more details. |
| bgAlpha |
Number |
0-100 |
Sets the alpha (transparency) for the background. If you've opted for gradient background, you need to set a list of alpha(s) separated by comma. See the gradient specification page for more details. |
| bgRatio |
Number |
0-100 |
If you've opted for a gradient background, this attribute lets you set the ratio of each color constituent. See the gradient specification page for more details. |
| bgAngle |
Number |
0-360 |
Angle of the background color, in case of a gradient. See the gradient specification page for more details. |
|
bgSWFDisplayMode Since v1.3 |
String |
stretch, tile, fit, fill, center, none |
Helps you specify the mode in which the background image is to be displayed.
- Stretch - disproportionately sets the full image on the chart area
- Tile - the image is repeated as a pattern on the entire chart area
- Fit - fits the image proportionately on the chart area
- Fill -proportionately fills the entire chart area with the image
- Center - the image is positioned at the center of the chart area
- None - Default mode. None of the above modes are applied
For more details click here. |
|
bgSWFVAlign Since v1.3 |
String |
left, center, right |
Helps you to vertically align the background image. |
|
bgSWFHAlign Since v1.3 |
String |
left, center, right |
Helps you to horizontally align the background image. |
|
bgSWFScale Since v1.3 |
Number |
0-300 |
Helps you magnify the background image.This attribute will only work when the attribute bgSWFDisplayMode is set to none, center or tile. |
| logoURL |
String |
URL |
You can load an external logo (JPEG/PNG/SWF) on the chart once it has rendered. This attribute lets you specify the URL of the same. Owing to Flash Player security settings, you can only specify logo that are on the sub-domain as the SWF file of the chart. |
| logoPosition |
String |
TL, TR, BL, BR, CC |
Where to position the logo on the chart:
- TL - Top-left
- TR - Top-right
- BR - Bottom right
- BL - Bottom left
- CC - Center of screen
|
| logoAlpha |
Number |
0-100 |
Once the logo has loaded on the chart, you can configure its opacity using this atribute. |
| logoScale |
Number |
0-300 |
You can also change the scale of externally loaded logo at run-time by specifying a value for this parameter. |
| logoLink |
String |
URL |
If you want to link the logo to an external URL, specify the link in this attribute. The link can be in FusionCharts link format, allowing you to link to new windows, pop-ups, frames etc. |
| showPlotBorder |
Boolean |
0/1 |
Whether the radar plot border would show up. |
| plotBorderColor |
Color |
|
Color for radar plot border |
| plotBorderThickness |
Number |
0-5 (Pixels) |
Thickness for radar plot border |
| plotBorderAlpha |
Number |
0-100 |
Alpha for radar plot border |
| plotFillAlpha |
Number |
0-100 |
Lets you set the fill alpha for radar plot. |
| plotFillColor |
Color |
|
Fill Color for the radar plot(hex code) |
| showRadarBorder |
Boolean |
0/1 |
Whether to show radar outside border? |
| radarBorderColor |
Color |
Hex Code |
Border color of radar outline. |
| radarBorderThickness |
Number |
In Pixels |
Border thickness of radar outline. |
| radarBorderAlpha |
Number |
0-100 |
Border alpha of radar outline. |
| radarFillColor |
Color |
Hex Code |
Fill color for the radar. |
| radarFillAlpha |
Number |
0-100 |
Fill alpha for the radar. |
| radarSpikeColor |
Color |
Hex Code |
Color for radar spikes. Radar spikes are the lines that emanate from the center to the vertex of radar. |
| radarSpikeThickness |
Number |
In Pixels |
Thickness for radar spikes. Radar spikes are the lines that emanate from the center to the vertex of radar. |
| radarSpikeAlpha |
Number |
0-100 |
Alpha for radar spikes. Radar spikes are the lines that emanate from the center to the vertex of radar. |
| drawAnchors |
Boolean |
0/1 |
Whether to draw anchors on the chart? If the anchors are not shown, then the tool tip and links won't work. |
| anchorSides |
Number |
3-20 |
This attribute sets the number of sides the anchor will have. For e.g., an anchor with 3 sides would represent a triangle, with 4 it would be a square and so on. |
| anchorRadius |
Number |
In Pixels |
This attribute sets the radius (in pixels) of the anchor. Greater the radius, bigger would be the anchor size. |
| anchorBorderColor |
Color |
Hex Code |
Lets you set the border color of anchors. |
| anchorBorderThickness |
Number |
In Pixels |
Helps you set border thickness of anchors. |
| anchorBgColor |
Color |
Hex Code |
Helps you set the background color of anchors. |
| anchorAlpha |
Number |
0-100 |
Helps you set the alpha of entire anchors. If you need to hide the anchors on chart but still enable tool tips, set this as 0. |
| anchorBgAlpha |
Number |
0-100 |
Helps you set the alpha of anchor background. |
| showLegend |
Boolean |
0/1 |
Whether to show legend for the chart (only multi-series and combination charts)? |
| legendPosition |
String |
BOTTOM or RIGHT |
The legend can be plotted at two positions on the chart - below the chart (BOTTOM) and on the RIGHT side of the chart. |
| legendCaption |
String |
|
You can add a caption for the entire legend by setting the same here. |
| legendIconScale
Since v1.3 |
Number |
0-5 |
Scaling of legend icon is possible starting FusionCharts for Flex v1.3. This attribute lets you control the size of legend icon. |
| legendBgColor |
Color |
Hex Code |
Background color for the legend. |
| legendBgAlpha |
Number |
0-100 |
Background alpha for the legend. |
| legendBorderColor |
Color |
Hex Code |
Border Color for the legend. |
| legendBorderThickness |
Number |
In Pixels |
Border thickness for the legend. |
| legendBorderAlpha |
Number |
0-100 |
Border alpha for the legend. |
| legendShadow |
Boolean |
0/1 |
Whether to show a shadow for legend? |
| legendAllowDrag |
Boolean |
0/1 |
The legend can be made drag-able by setting this attribute to 1. End viewers of the chart can drag the legend around on the chart. |
| legendScrollBgColor |
Color |
Hex Code |
If you've too many items on the legend, a scroll bar shows up on the same. This attribute lets you configure the background color of the scroll bar. |
| legendScrollBarColor |
Color |
Hex Code |
If you've too many items on the legend, a scroll bar shows up on the same. This attribute lets you configure the bar color of the scroll bar. |
| legendScrollBtnColor |
Color |
Hex Code |
If you've too many items on the legend, a scroll bar shows up on the same. This attribute lets you configure the color of buttons of the scroll bar. |
| reverseLegend |
Boolean |
0/1 |
You can reverse the ordering of datasets in the legend by setting this attribute to 1. |
| interactiveLegend
Since v1.3 |
Boolean |
0/1 |
This attribute lets you interact with the legend in your chart. When you click a legend key, the dataplots associated with that series are eliminated from the chart. Re-clicking the key causes the dataplots to reappear. |
| legendNumColumns
Since v1.3 |
Number |
Positive Integer |
If your chart contains multiple series, the legend is displayed as a grid comprising of multiple legend keys. With the help of this attribute you can specify the number of columns that are to be displayed in the legend. |
| minimiseWrappingInLegend
Since v1.3 |
Boolean |
0/1 |
Whether to minimize legend item text wrapping. |
| legendMarkerCircle deprecated. Not applicable. |
Boolean |
0/1 |
Whether to use square legend keys or circular ones. |
| formatNumber |
Boolean |
0/1 |
This configuration determines whether the numbers displayed on the chart will be formatted using commas, e.g., 40,000 if formatNumber='1' and 40000 if formatNumber='0 ' |
| formatNumberScale |
Boolean |
0/1 |
Configuration whether to add K (thousands) and M (millions) to a number after truncating and rounding it - e.g., if formatNumberScale is set to 1, 1043 would become 1.04K (with decimals set to 2 places). Same with numbers in millions - a M will added at the end. For more details, please see Advanced Number Formatting section. |
| defaultNumberScale |
String |
|
The default unit of the numbers that you're providing to the chart. For more details, please see Advanced Number Formatting section. |
| numberScaleUnit |
String |
|
Unit of each block of the scale. For more details, please see Advanced Number Formatting section. |
| numberScaleValue |
String |
|
Range of the various blocks that constitute the scale. For more details, please see Advanced Number Formatting section. |
| numberPrefix |
String |
Character |
Using this attribute, you could add prefix to all the numbers visible on the graph. For example, to represent all dollars figure on the chart, you could specify this attribute to ' $' to show like $40000, $50000. For more details, please see Advanced Number Formatting section. |
| numberSuffix |
String |
Character |
Using this attribute, you could add suffix to all the numbers visible on the graph. For example, to represent all figure quantified as per annum on the chart, you could specify this attribute to ' /a' to show like 40000/a, 50000/a. For more details, please see Advanced Number Formatting section. |
| decimalSeparator |
String |
Character |
This option helps you specify the character to be used as the decimal separator in a number. For more details, please see Advanced Number Formatting section. |
| thousandSeparator |
String |
Character |
This option helps you specify the character to be used as the thousands separator in a number. For more details, please see Advanced Number Formatting section. |
| inDecimalSeparator |
String |
Character |
In some countries, commas are used as decimal separators and dots as thousand separators. In XML, if you specify such values, it will give a error while converting to number. So, FusionCharts accepts the input decimal and thousand separator from user, so that it can covert it accordingly into the required format. This attribute lets you input the decimal separator. For more details, please see Advanced Number Formatting section. |
| inThousandSeparator |
String |
Character |
In some countries, commas are used as decimal separators and dots as thousand separators. In XML, if you specify such values, it will give a error while converting to number. So, FusionCharts accepts the input decimal and thousand separator from user, so that it can covert it accordingly into the required format. This attribute lets you input the thousand separator. For more details, please see Advanced Number Formatting section. |
| decimals |
Number |
0-10 |
Number of decimal places to which all numbers on the chart would be rounded to. |
| forceDecimals |
Boolean |
0-1 |
Whether to add 0 padding at the end of decimal numbers? For example, if you set decimals as 2 and a number is 23.4. If forceDecimals is set to 1, FusionCharts will convert the number to 23.40 (note the extra 0 at the end) |
| forceYAxisValueDecimals
Since v1.3 |
Boolean |
0/1 |
Whether to forcefully attach decimal places to all y-axis values. For example, If you limit the maximum number of decimal digits to 2, a number like 55.345 will be rounded to 55.34. This does not mean that all y-axis numbers will be displayed with a fixed number of decimal places. For instance 55 will not be displayed as 55.00 and 55.1 will not become 55.10. In order to have fixed number of decimal places attached to all y-axis numbers, set this attribute to 1. |
| yAxisValueDecimals |
Number |
0-10 |
If you've opted to not adjust div lines, you can specify the div line values decimal precision using this attribute. |
| baseFont |
String |
Font Name |
This attribute lets you set the font face (family) of all the text (data labels, values etc.) on chart. If you specify outCnvBaseFont attribute also, then this attribute controls only the font face of text within the chart canvas bounds. |
| baseFontSize |
Number |
0-72 |
This attribute sets the base font size of the chart i.e., all the values and the names in the chart which lie on the canvas will be displayed using the font size provided here. |
| baseFontColor |
Color |
|
This attribute sets the base font color of the chart i.e., all the values and the names in the chart which lie on the canvas will be displayed using the font color provided here. |
| outCnvBaseFont |
String |
Font Name |
This attribute sets the base font family of the chart font which lies outside the canvas i.e., all the values and the names in the chart which lie outside the canvas will be displayed using the font name provided here. |
| outCnvBaseFontSize |
Number |
0-72 |
This attribute sets the base font size of the chart i.e., all the values and the names in the chart which lie outside the canvas will be displayed using the font size provided here. |
| outCnvBaseFontColor |
Color |
|
This attribute sets the base font color of the chart i.e., all the values and the names in the chart which lie outside the canvas will be displayed using the font color provided here. |
| captionPadding |
Number |
In Pixels |
This attribute lets you control the space (in pixels) between the sub-caption and top of the chart canvas. If the sub-caption is not defined, it controls the space between caption and top of chart canvas. If neither caption, nor sub-caption is defined, this padding does not come into play. |
| labelPadding |
Number |
In Pixels |
This attribute sets the vertical space between the labels and canvas bottom edge. If you want more space between the canvas and the x-axis labels, you can use this attribute to control it. |
| chartLeftMargin |
Number |
In Pixels |
Amount of empty space that you want to put on the left side of your chart. Nothing is rendered in this space. |
| chartRightMargin |
Number |
In Pixels |
Amount of empty space that you want to put on the right side of your chart. Nothing is rendered in this space. |
| chartTopMargin |
Number |
In Pixels |
Amount of empty space that you want to put on the top of your chart. Nothing is rendered in this space. |
| chartBottomMargin |
Number |
In Pixels |
Amount of empty space that you want to put on the bottom of your chart. Nothing is rendered in this space. |
| legendPadding |
Number |
In Pixels |
Padding of legend from right/bottom side of canvas |
| seriesName |
String |
|
Lets you specify the series name for a particular data-set. For example, if you're plotting a chart to indicate monthly sales analysis for 2005 and 2006, the seriesName for the first dataset would be 2005 and that of the second would be 2006. The seriesName of a data-set is shown in legend. |
| color |
Color |
Hex Code (Or Comma separated list) |
This attribute sets the color using which columns, lines, area of that data-set would be drawn. For column chart, you can specify a list of comma separated hex codes to get a gradient plot. |
| alpha |
String |
0-100 or Comma Separated List |
This attribute sets the alpha (transparency) of the entire data-set. |
| showValues |
Boolean |
0/1 |
Whether to show the values for this data-set? |
| includeInLegend |
Boolean |
0/1 |
Whether to include the seriesName of this data-set in legend? This can be particularly useful when you're using combination charts and you've used the area/line chart to plot a trend, and you do not want the seriesName of that trend to appear in legend. |
| showPlotBorder |
Boolean |
0/1 |
Whether to show the border of this data-set? |
| plotBorderColor |
Color |
|
Color for data plot border of this data-set |
| plotBorderThickness |
Number |
0-5 (Pixels) |
Thickness for data plot border of this data-set |
| plotBorderAlpha |
Number |
0-100 |
Alpha for data plot border of this data-set |
| drawAnchors |
Boolean |
0/1 |
Whether to draw anchors for the particular data-set? If the anchors are not shown, then the tool tip and links won't work for the data-set. |
| anchorSides |
Number |
3-20 |
Sets the number of sides that the anchors of the particular data-set will have. For e.g., an anchor with 3 sides would represent a triangle, with 4 it would be a square and so on. |
| anchorRadius |
Number |
In Pixels |
This attribute sets the radius (in pixels) of the anchors of the particular data-set. Greater the radius, bigger would be the anchor size. |
| anchorBorderColor |
Color |
Hex Code |
Lets you set the border color of anchors of the particular data-set. |
| anchorBorderThickness |
Number |
In Pixels |
Helps you set border thickness of anchors of the particular data-set. |
| anchorBgColor |
Color |
Hex Code |
Helps you set the background color of anchors of the particular data-set. |
| anchorAlpha |
Number |
0-100 |
Helps you set the alpha of entire anchors of the particular data-set. If you need to hide the anchors for the data-set but still enable tool tips, set this as 0. |
| anchorBgAlpha |
Number |
0-100 |
Helps you set the alpha of anchor background of the particular data-set. |
| value |
Number |
|
Numerical value for the data item. This value would be plotted on the chart. |
| color |
Color |
Hex Code |
For multi-series and combination charts, you can define the color of data-sets at dataset level. However, if you wish to highlight a particular data element, you can specify it's color at "set" level using this attribute. This attribute accepts hex color codes without #. |
| displayValue |
String |
|
If instead of the numerical value of this data, you wish to display a custom string value, you can specify the same here. Examples are annotation for a data item etc. |
| link |
String |
|
You can define links for individual data items. That enables the end user to click on data items (columns, lines, bars etc.) and drill down to other pages. To define the link for data items, use the link attribute.
You can define links that open in same window, new window, pop-up window or frames. Please see "Advanced Charting > Drill Down Charts" for more information.
Also, you'll need to URL Encode all the special characters (like ? and &) present in the link. |
| toolText |
String |
|
By default, FusionCharts shows the series Name, Category Name and value as tool tip text for that data item. But, if you want to display more information for the data item as tool tip, you can use this attribute to specify the same. |
| showValue |
Boolean |
0/1 |
You can individually opt to show/hide values of individual data items using this attribute. This value over-rides the data-set level value. |
| alpha |
Number |
0-100 |
For multi-series and combination charts, you can define the alpha of data-sets at dataset level. However, if you wish to highlight a particular data element, you can specify it's alpha at "set" level using this attribute. |
| anchorSides |
Number |
3-20 |
Lets you specify "set" specific sides of the anchor. |
| anchorRadius |
Number |
In Pixels |
Lets you specify "set" specific radius (in pixels) of the anchor. |
| anchorBorderColor |
Color |
Hex Code |
Lets you specify "set" specific border color of the anchor. |
| anchorBorderThickness |
Number |
In Pixels |
Lets you specify "set" specific border thickness of the anchor. |
| anchorBgColor |
Color |
Hex Code |
Lets you specify "set" specific background color of the anchor. |
| anchorAlpha |
Number |
0-100 |
Lets you specify "set" specific alpha of the anchor. |
| anchorBgAlpha |
Number |
0-100 |
Lets you specify "set" specific alpha of the anchor background. |
 Functional Attributes