Divisional Lines
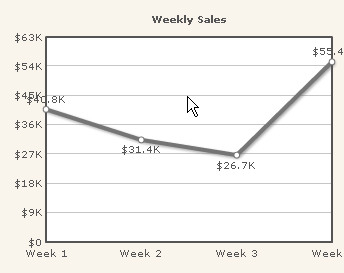
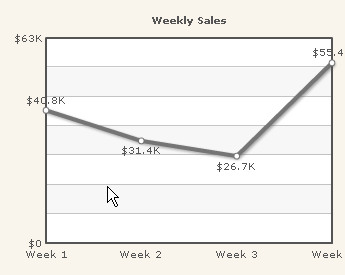
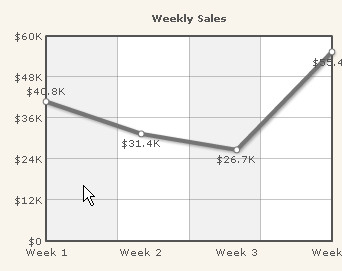
&chartParams=[bgColor=FFFFFF;caption=Weekly Sales;numberPrefix=$;showAlternateHGridColor=0]
&labels=Week 1;Week 2;Week 3;Week 4
&data=40800;31400;26700;55400

&chartParams=[bgColor=FFFFFF;caption=Weekly Sales;numberPrefix=$;
numDivLines=6;showAlternateHGridColor=0]
&labels=Week 1;Week 2;Week 3;Week 4
&data=40800;31400;26700;55400
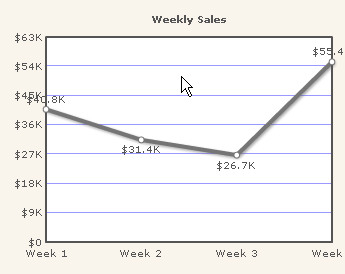
numDivLines=6;divLineColor=0000FF;showAlternateHGridColor=0]
&labels=Week 1;Week 2;Week 3;Week 4
&data=40800;31400;26700;55400
numDivLines=6;divLineColor=0000FF;divLineThickness=4;showAlternateHGridColor=0]
&labels=Week 1;Week 2;Week 3;Week 4
&data=40800;31400;26700;55400

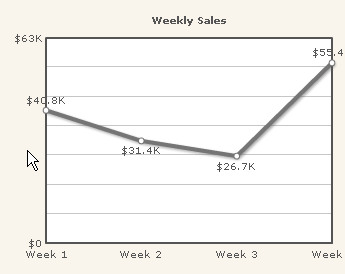
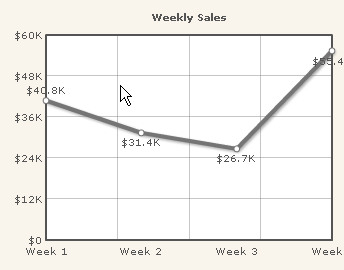
&chartParams=[bgColor=FFFFFF;caption=Weekly Sales;numberPrefix=$;
showDivLineValues=0;numDivLines=6;showAlternateHGridColor=0]
&labels=Week 1;Week 2;Week 3;Week 4
&data=40800;31400;26700;55400
&chartParams=[bgColor=FFFFFF;caption=Weekly Sales;numberPrefix=$;
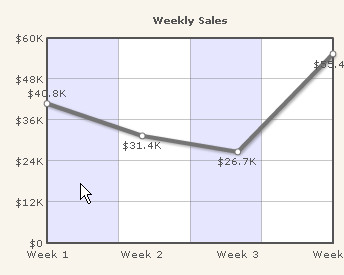
showDivLineValues=0;numDivLines=6;showAlternateHGridColor=1]
&labels=Week 1;Week 2;Week 3;Week 4
&data=40800;31400;26700;55400
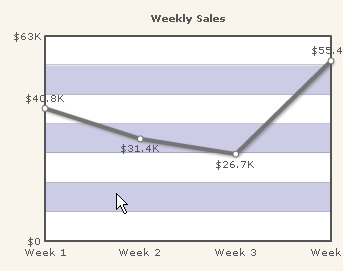
&chartParams=[bgColor=FFFFFF;caption=Weekly Sales;numberPrefix=$;
showDivLineValues=0;numDivLines=6;showAlternateHGridColor=1;alternateHGridColor=9999CC]
&labels=Week 1;Week 2;Week 3;Week 4
&data=40800;31400;26700;55400
&chartParams=[bgColor=FFFFFF;caption=Weekly Sales;numberPrefix=$;
numVDivLines=3;showAlternateHGridColor=0]
&labels=Week 1;Week 2;Week 3;Week 4
&data=40800;31400;26700;55400
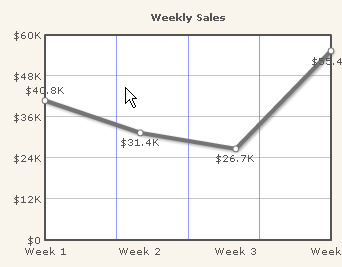
&chartParams=[bgColor=FFFFFF;caption=Weekly Sales;numberPrefix=$;
numVDivLines=3;vDivLineColor=0000FF;showAlternateHGridColor=0]
&labels=Week 1;Week 2;Week 3;Week 4
&data=40800;31400;26700;55400
&chartParams=[bgColor=FFFFFF;caption=Weekly Sales;numberPrefix=$;
numVDivLines=3;vDivLineColor=0000FF;vDivLineThickness=4;showAlternateHGridColor=0]
&labels=Week 1;Week 2;Week 3;Week 4
&data=40800;31400;26700;55400

&chartParams=[bgColor=FFFFFF;caption=Weekly Sales;numberPrefix=$;
numVDivLines=3;showAlternateHGridColor=0;showAlternateVGridColor=1]
&labels=Week 1;Week 2;Week 3;Week 4
&data=40800;31400;26700;55400
&chartParams=[bgColor=FFFFFF;caption=Weekly Sales;numberPrefix=$;
numVDivLines=3;showAlternateHGridColor=0;showAlternateVGridColor=1;alternateVGridColor=0000FF]
&labels=Week 1;Week 2;Week 3;Week 4
&data=40800;31400;26700;55400
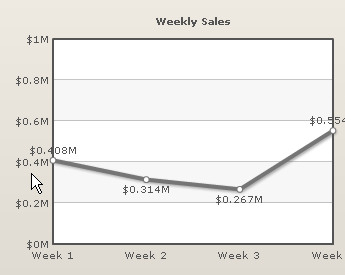
&chartParams=[caption=Weekly Sales;numberPrefix=$;numberSuffix=M;yAxisValueDecimals=1]
&labels=Week 1;Week 2;Week 3;Week 4&data=.40800;.31400;.26700;.55400
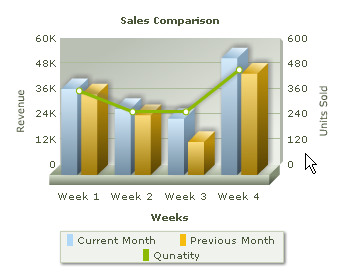
showDivLineSecondaryValue allows us to show/hide the values of Secondary Divisional Lines, used in Combination Charts. As Combination Charts deal with Primary and Secondary Y-Axis, the Divisional Lines also have two values. showDivLinesSecondaryValue accepts 0/1 to hide/show the values.
Let's try with a simple example where we hide the values of the divisional lines from secondary axis.
&chartParams=[caption=Sales Comparison;xAxisName=Weeks;PYAxisName=Revenue;SYAxisName=Units Sold;
showDivLineSecondaryValue=0;showValues=0]
&labels=Week 1;Week 2;Week 3;Week 4
&data=[seriesName=Current Month;numberPrefix=$]40800;31400;26700;55400
&data=[seriesName=Previous Month;numberPrefix=$]38300;28400;15700;48100
&data=[SeriesName=Qunatity;parentYaxis=s]400;300;300;500
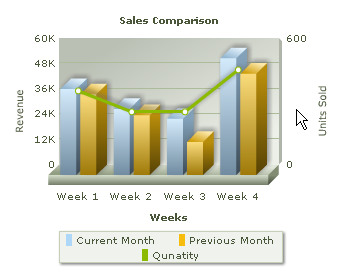
&chartParams=[caption=Sales Comparison;xAxisName=Weeks;PYAxisName=Revenue;SYAxisName=Units Sold;
showDivLineSecondaryValue=1;showValues=0]
&labels=Week 1;Week 2;Week 3;Week 4
&data=[seriesName=Current Month;numberPrefix=$]40800;31400;26700;55400
&data=[seriesName=Previous Month;numberPrefix=$]38300;28400;15700;48100
&data=[SeriesName=Qunatity;parentYaxis=s]400;300;300;500