Number scaling lets you shorten the numbers on charts using commonly used scales (like K,M etc.). You can define your own scales for numbers and then apply it to all numbers on the chart.
Let's start with the most basic example which is already defined in FusionCharts XT- thousands (K) and millions (M) scale.
By default, if your numbers on the chart are greater than 1000, FusionCharts XT scales them to K (Thousands) or M (Millions). For example, if you plot a chart with data as 12500, 13400 and 13300, you'll see the following chart:
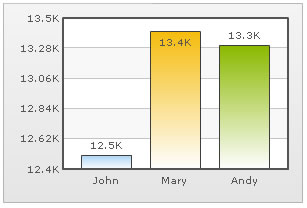
As you can see above, FusionCharts XT has scaled the numbers down to K. By default, FusionCharts XT has the K,M (1000,1000) scaling defined for each chart. If you do not want this scaling to be applied by default, you can set:
You can, however, change it to anything you wish. Let's see it in the next example.
FusionCharts XT, by default, has 1000,1000 (K,M) scaling defined for all charts. It doesn't have the scaling for billions defined. Let's modify the number scaling to add billion so that the final scale looks like 1000,1000,1000 (K,M,B).
This scale, in human terms, will look something as under:
1000 = 1 K
1000 K = 1 M
1000 M = 1 B
Now, to convert this scale into FusionCharts XT XML/JSON format, you'll have to do the following:
- Define your own scale for the chart as under:
If you carefully see this and match it with previous table, you'll find that whatever numeric figure was present on the left hand side of the table is put in numberScaleValue and whatever unit was present on the right side of the scale table has been put under numberScaleUnit - all separated by commas.
- Set the chart formatting flags to on as under:
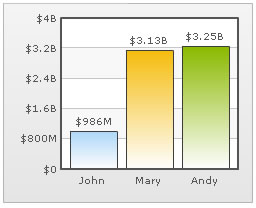
When you now view a chart containing data in billions, you'll see as under. Note that the chart now contains figure both in millions and billions.
The XML/JSON for this chart can be listed as under:
<chart numberScaleValue='1000,1000,1000' numberScaleUnit='K,M,B' numberPrefix='$'>
  <set label='John' value='986000000' />
  <set label='Mary' value='3134000000' />
  <set label='Andy' value='3245000000' />
</chart>
{
  "chart":{
    "numberscalevalue":"1000,1000,1000",
    "numberscaleunit":"K,M,B",
    "numberprefix":"$"
  },
  "data":[{
      "label":"John",
      "value":"986000000"
    },
    {
      "label":"Mary",
      "value":"3134000000"
    },
    {
      "label":"Andy",
      "value":"3245000000"
    }
  ]
}
In case of dual y-axis charts, to apply this scaling to the secondary axis, you will need to write the following XML/JSON (note the s prefix before each attribute indicating secondary axis).
<chart sFormatNumberScale='1' sNumberScaleValue='1000,1000,1000' sNumberScaleUnit='K,M,B' sNumberPrefix='$'>
   <set label='John' value='986000000' />
   <set label='Mary' value='3134000000' />
   <set label='Andy' value='3245000000' />
</chart>
{
  "chart":{
    "sformatnumberscale":"1",
    "snumberscalevalue":"1000,1000,1000",
    "snumberscaleunit":"K,M,B",
    "snumberprefix":"$"
  },
  "data":[{
      "label":"John",
      "value":"986000000"
    },
    {
      "label":"Mary",
      "value":"3134000000"
    },
    {
      "label":"Andy",
      "value":"3245000000"
    }
  ]
}
Let's consider another example where we intend to plot time related figures on the chart. Say we're plotting a chart which indicates the time taken by a list of automated processes. Each process in the list can take time ranging from a few seconds to few days. And we've the data for each process in seconds itself. Now, if we were to show all the data on the chart in seconds only, it won't appear too legible. What we can do is build a scale indicating time and then specify it to the chart. This scale, in human terms, will look something as under:
60 seconds = 1 minute
60 minute = 1 hr
24 hrs = 1 day
7 days = 1 week
Now, to convert this scale into FusionCharts XT XML/JSON format, you'll have to do it as under:
- First you will need to define the unit of the data which you're providing. Like, in this example, you're providing all data in seconds. So, default number scale will be represented in seconds. We can represent it as under:
- Next, we define our own scale for the chart as under:
Again, if you carefully see this and match it with our range, you'll find that whatever numeric figures are present on the left hand side of the range is put in numberScaleValue and whatever units are present on the right side of the scale has been put under numberScaleUnit - all separated by commas.
- Set the chart formatting flags to on as under:
The entire data looks as under:
<chart defaultNumberScale='s' numberScaleValue='60,60,24,7' numberScaleUnit='min,hr,day,wk'>
   <set label='A' value='38' />
   <set label='B' value='150' />
   <set label='C' value='11050' />
   <set label='D' value='334345' />
   <set label='E' value='1334345' />
</chart>
{
  "chart":{
    "defaultnumberscale":"s",
    "numberscalevalue":"60,60,24,7",
    "numberscaleunit":"min,hr,day,wk"
  },
  "data":[{
      "label":"A",
      "value":"38"
    },
    {
      "label":"B",
      "value":"150"
    },
    {
      "label":"C",
      "value":"11050"
    },
    {
      "label":"D",
      "value":"334345"
    },
    {
      "label":"E",
      "value":"1334345"
    }
  ]
}
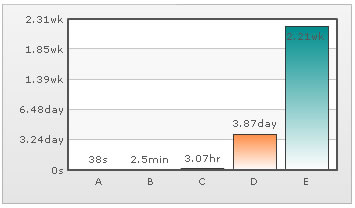
When you now view the chart, you'll see that all the data has been automatically scaled to the best value. Like:
38 was converted to 38s
150 was converted to 2.50min
11050 was converted to 3.07hr
334345 was converted to 3.87 day
1334345 was converted to 2.21wk
In case of dual y-axis charts, to apply this scaling to the secondary axis, you will need to write the following XML/JSON (note the s prefix before each attribute indicating secondary axis).
<chart sFormatNumberScale='1' sDefaultNumberScale='s' sNumberScaleValue='60,60,24,7' sNumberScaleUnit='min,hr,day,wk'>
   <set label='A' value='38' />
   <set label='B' value='150' />
   <set label='C' value='11050' />
   <set label='D' value='334345' />
   <set label='E' value='1334345' />
</chart>
{
  "chart":{
    "sformatnumberscale":"1",
    "sdefaultnumberscale":"s",
    "snumberscalevalue":"60,60,24,7",
    "snumberscaleunit":"min,hr,day,wk"
  },
  "data":[{
      "label":"A",
      "value":"38"
    },
    {
      "label":"B",
      "value":"150"
    },
    {
      "label":"C",
      "value":"11050"
    },
    {
      "label":"D",
      "value":"334345"
    },
    {
      "label":"E",
      "value":"1334345"
    }
  ]
}
Take another example, where you're plotting a chart indicating memory usage of a network server. The usage can be from few bits to a few gigabytes. Again, you've all your data in bits - so we can render the range as under:
8 bits = 1 Byte
1024 bytes = 1 KB
1024 KB = 1 MB
1024 MB = 1 GB
1024 GB = 1 TB
And the XML/JSON can be written as under:
Similarly, for dual y-axis chart, it will be:
Let's consider another length/distance example. The standard length/distance range can be rendered as under (with inches being the default unit):
12 inches = 1 feet
3 feet = 1 yard
1760 yards = 1 mile
So, we can write the XML/JSON as under:
Similarly, for dual y-axis chart, it will be:
FusionCharts XT-Service Release 3 introduces the Recursive Number Scaling feature. Recursive number scaling comes into the picture when you have number scales defined for your chart. It helps you display the chart data better by breaking-up the predefined number scale into smaller sections. For example, in a chart where time is being plotted, you can display 3.87 days as 3 days, 20 hours, 52 minutes and 25 seconds.
Let us jump to an example straightaway to understand this better.
Let us build a chart which indicates the time taken by a list of automated processes. Each process in the list can take time ranging from a few seconds to few days. And we have the data for each process in seconds itself. Now, if we were to show all the data on the chart in seconds only, it will not appear too legible. What we can do is build a scale indicating time and then specify it to the chart. This scale will look something as under:
60 seconds = 1 minute
60 minute = 1 hr
24 hrs = 1 day
7 days = 1 week
We can define the same in our chart using:
<chart defaultNumberScale='s' numberScaleValue='60,60,24,7' numberScaleUnit='min,hr,day,wk' ... >
Please see the Number Scaling page for more details on how to build a number scale. Now let us consider the data below:
<chart defaultNumberScale='s' numberScaleValue='60,60,24,7' numberScaleUnit='min,hr,day,wk'>
   <set label='A' value='38' />
   <set label='B' value='150' />
   <set label='C' value='81050' />
   <set label='D' value='334345' />
   <set label='E' value='534345' />
</chart>
{
  "chart": {
    "defaultnumberscale": "s",
    "numberscalevalue": "60,60,24,7",
    "numberscaleunit": "min,hr,day,wk"
  },
  "data": [
    {
      "label": "A",
      "value": "38"
    },
    {
      "label": "B",
      "value": "150"
    },
    {
      "label": "C",
      "value": "81050"
    },
    {
      "label": "D",
      "value": "334345"
    },
    {
      "label": "E",
      "value": "534345"
    }
  ]
}
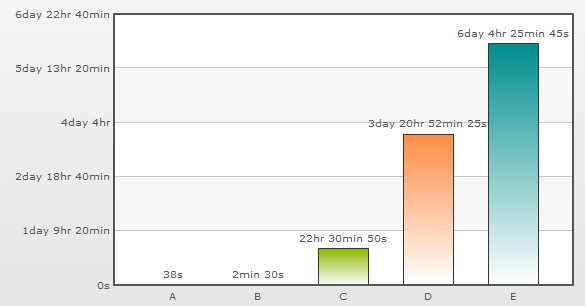
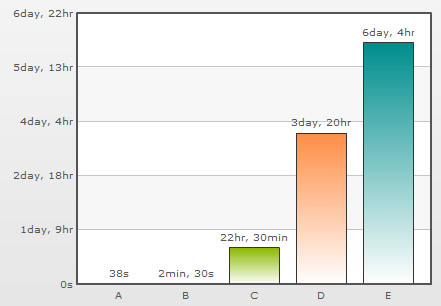
Notice how 22.51 hours is converted to 22 hrs, 30 mins and 50 s; 3.87 days to 3 days, 20 hrs, 52 mins and 25 s. This chart makes use of recursive number scaling and after converting the time in seconds to say hours, whatever is left over is not converted into decimals and shown. It is rather converted into smaller units of time and broken down as far as possible - so the remaining seconds are first converted to minutes and then when the seconds are too few to be converted into minutes, they are displayed in seconds itself. This gives us a fair idea of how much time was used for each task.
To use recursive number scaling, all you have to do is set <chart ... scaleRecursively='1' .. >.
The entire XML/JSON for the chart above is:
<chart defaultNumberScale='s' numberScaleValue='60,60,24,7' numberScaleUnit='min,hr,day,wk' scaleRecursively='1'>
   <set label='A' value='38' />
   <set label='B' value='150' />
   <set label='C' value='81050' />
   <set label='D' value='334345' />
   <set label='E' value='534345' />
</chart>
{
  "chart": {
    "defaultnumberscale": "s",
    "numberscalevalue": "60,60,24,7",
    "numberscaleunit": "min,hr,day,wk",
    "scalerecursively": "1"
  },
  "data": [
    {
      "label": "A",
      "value": "38"
    },
    {
      "label": "B",
      "value": "150"
    },
    {
      "label": "C",
      "value": "81050"
    },
    {
      "label": "D",
      "value": "334345"
    },
    {
      "label": "E",
      "value": "534345"
    }
  ]
}
You can also control the levels of recursion. Suppose in the above chart, instead of 3 days, 20 hrs, 52 mins and 25 s, you are pretty happy with showing 3 day, 20 hrs itself either for space constraints or some other good reason. You can control the levels of recursion for all the numbers on your chart using the maxScaleRecursion attribute. Suppose you want only two levels of recursion, then set <chart ... maxScaleRecursion='2'>. This will convert the above chart to:

Notice how all the numbers on the chart are using a maximum of two time units - the rest have been truncated. When you want all the units of a number to be shown on the chart, you can either omit the maxScaleRecursion attribute or set it to -1.
By default, all the units of a number are separated by a space. You can customize the separator using the scaleSeparator attribute. For example, setting scaleSeparator=', ' will separate each unit with a comma as shown below:
Note:
For Scatter and Bubble charts, xScaleRecursively, xMaxScaleRecursion and xScaleSeparator attributes are used to scale the numbers recursively on the X-Axis. These attributes will work only when the xAxisLabelMode attribute is set to AUTO or MIXED.
To scale the numbers recursively on the Secondary Y-Axis in a Dual Y-Axis chart, the attributes sScaleRecursively, sMaxScaleRecursion and sScaleSeparator are used.