FusionCharts can effectively be used with ColdFusion to plot dynamic data-driven charts.
Even when used with ColdFusion, FusionCharts internally uses JavaScript and XML/JSON to render the charts. The ColdFusion code actually helps you output this JavaScript and XML/JSON. To aid your understanding of this section, we would recommend you to go through the following sections of documentation (if you've not already read them):
- Creating your first chart
- changing chart type and size
- Configuring chart background, canvas, fonts, captions, data plot, labels, values, axis, legend, padding & margins and number formatting
- Using XML or JSON as data source
- Using JavaScript API of FusionCharts
- Creating drill-down charts and LinkedCharts
- Exporting charts as images or CSV
- How FusionCharts work?
In this example, we'll show a few basic examples to help you get started.
We'll cover the following examples here:
- We'll use FusionCharts in ColdFusion with a pre-built Data.xml (which contains data to plot)
- We'll then change the above chart into a single page chart using dataXML method.
- Finally, we'll use FusionCharts JavaScript class to embed the chart.
Let's quickly see each of them.
Before you proceed with the contents in this page, we strictly recommend you to please go through the section "How FusionCharts works?".
Let's build our first example. In this example, we'll create a "Monthly Unit Sales" chart using dataURL method. For a start, we'll hard code our XML data in a physical XML document Data.xml and then utilize it in our chart contained in a
ColdFusion Page (BasicChart.cfm).
Let's first have a look at the XML Data document:
<set label='Jan' value='462' />
<set label='Feb' value='857' />
<set label='Mar' value='671' />
<set label='Apr' value='494' />
<set label='May' value='761' />
<set label='Jun' value='960' />
<set label='Jul' value='629' />
<set label='Aug' value='622' />
<set label='Sep' value='376' />
<set label='Oct' value='494' />
<set label='Nov' value='761' />
<set label='Dec' value='960' />
</chart>
This XML is stored as Data.xml in Data Folder under BasicExample folder. It basically contains the data to create a single series chart to show "Monthly Unit Sales". We'll plot this on a Column 3D Chart. Let's see how to do that.
To plot a Chart that consumes this data, you need to include the HTML code to embed a Flash object and then provide the requisite parameters. To make things simpler for you, we've put all this functionality in a CFM function named as renderChartHTML(). This function is contained in Download Package > Code > CFM > Includes > FusionCharts.cfm file. So, whenever you need to work with FusionCharts in CFM, just include this file in your page and then you can work with FusionCharts very easily.
Let's see it in example. BasicChart.cfm contains the following code to render the chart:
<HEAD>
<TITLE>
FusionCharts - Simple Column 3D Chart
</TITLE>
</HEAD>
<cfinclude template="../Includes/FusionCharts.cfm">
<BODY>
<CENTER>
<h2>FusionCharts Examples</h2>
<h4>Basic example using pre-built Data.xml</h4>
<cfoutput>#renderChartHTML("../../FusionCharts/Column3D.swf", "Data/Data.xml", "", "myFirst", 600, 300, false)#</cfoutput>
</CENTER>
</BODY>
</HTML>
As you can see above, we've first included FusionCharts.cfm to help us easily create charts. After that, we've simply invoked the renderChartHTML function to render the chart. To this function, you can pass the following parameters (in same order):
| Parameter | Description |
| chartSWF | SWF File Name (and Path) of the chart which you intend to plot. Here, we are plotting a Column 3D chart. So, we've specified it as ../../FusionCharts/Column3D.swf |
| strURL | If you intend to use dataURL method for the chart, pass the Url as this parameter. Else, set it to "" (in case of dataXML method). In this case, we're using Data.xml file, so we specify Data/Data.xml |
| strXML | If you intend to use dataXML method for this chart, pass the XML data as this parameter. Else, set it to "" (in case of dataURL method). Since we're using dataURL method, we specify this parameter as "". |
| chartId | Id for the chart, using which it will be recognized in the HTML page. Each chart on the page needs to have a unique Id. |
| chartWidth | Intended width for the chart (in pixels) |
| chartHeight | Intended height for the chart (in pixels) |
| debugMode | Whether to start the chart in debug mode. Please see Debugging your Charts section for more details on Debug Mode. |
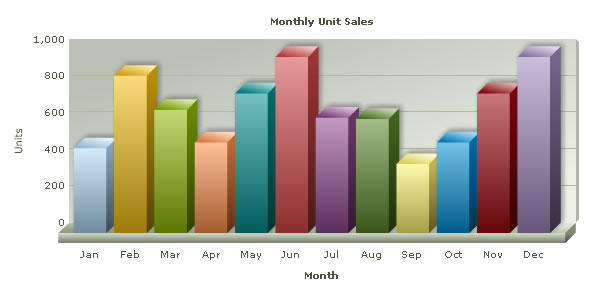
When you now run this page, you'll see a chart like the one below.
If you do not see a chart like the one below, please follow the steps listed in Debugging your Charts > Basic Troubleshooting section of this documentation.
<HTML>
<HEAD>
<TITLE>
FusionCharts - Simple Column 3D Chart using dataXML method
</TITLE>
</HEAD>
<cfinclude template="../Includes/FusionCharts.cfm">
<BODY>
<cfset strXML = "">
<cfset strXML = strXML & "<chart caption='Monthly Unit Sales' xAxisName='Month' yAxisName='Units' showValues='0' formatNumberScale='0' showBorder='1'>">
<cfset strXML = strXML & "<set label='Jan' value='462' />">
<cfset strXML = strXML & "<set label='Feb' value='857' />">
<cfset strXML = strXML & "<set label='Mar' value='671' />">
<cfset strXML = strXML & "<set label='Apr' value='494' />">
<cfset strXML = strXML & "<set label='May' value='761' />">
<cfset strXML = strXML & "<set label='Jun' value='960' />">
<cfset strXML = strXML & "<set label='Jul' value='629' />">
<cfset strXML = strXML & "<set label='Aug' value='622' />">
<cfset strXML = strXML & "<set label='Sep' value='376' />">
<cfset strXML = strXML & "<set label='Oct' value='494' />">
<cfset strXML = strXML & "<set label='Nov' value='761' />">
<cfset strXML = strXML & "<set label='Dec' value='960' />">
<cfset strXML = strXML & "</chart>">
<!--- Create the chart - Column 3D Chart with data from strXML variable using dataXML method --->
<cfoutput>#renderChartHTML("../../FusionCharts/Column3D.swf", "", strXML, "myNext", 600, 300, false)#</cfoutput>
</BODY>
</HTML>
As you can see above, we:
- Include FusionCharts.cfm file to render charts easily
- Create the XML data document in a CFM variable strXML using string concatenation. Here, we're hard-coding the data. In your applications, you can build this data dynamically after interacting with databases or external sources of data.
- Finally, create the chart and set the dataXML parameter as strXML. We leave dataURL parameter blank.
When you see this chart, you'll get the same results as before.
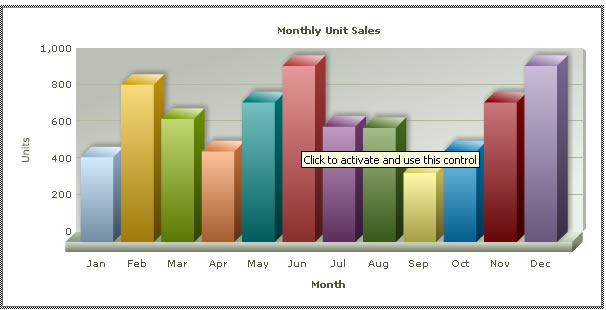
Internet Explorer asks you to "Click and activate..." to use the chart. This is happening because of a technical issue in Internet Explorer on part of Microsoft Corporation. As such, all Flash movies need to be clicked once before you can start interacting with them.
However, the good news is that there's a solution to it. This thing happens only when you directly embed the HTML code of the chart. It would NOT happen when you use JavaScript to embed the chart. To see how to embed using JavaScript at code level, please see Creating Your First Chart > JavaScript Embedding Section.
Again, to make things simpler for you, we've provided a CFM function called renderChart() which helps you wrap this JavaScript function in CFM function, so that you don't have to get your hands dirty with JavaScript, Flash and HTML. This function is contained in the previously used FusionCharts.cfm file.
Let's now quickly put up a sample to show the use of this function. We create another CFM page SimpleChart.cfm to use this function to plot a chart from data contained in our previously created Data.xml file. It contains the following code:
<HEAD>
<TITLE>
FusionCharts - Simple Column 3D Chart
</TITLE>
<SCRIPT LANGUAGE="Javascript" SRC="../../FusionCharts/FusionCharts.js"></SCRIPT>
</HEAD>
<cfinclude template="../Includes/FusionCharts.cfm">
<BODY>
<!--- Create the chart - Column 3D Chart with data from Data/Data.xml --->
<cfoutput>#renderChart("../../FusionCharts/Column3D.swf", "Data/Data.xml", "", "myFirst", 600, 300, false, false)#</cfoutput>
</BODY>
</HTML>
As you can see above, we've:
- Included FusionCharts.js file, which is required when using the JavaScript method.
- Included FusionCharts.cfm file.
- Created the chart using renderChart() method.
The renderChart() method takes in the following parameters:
| Parameter | Description |
| chartSWF | SWF File Name (and Path) of the chart which you intend to plot. Here, we are plotting a Column 3D chart. So, we've specified it as ../../FusionCharts/Column3D.swf |
| strURL | If you intend to use dataURL method for the chart, pass the Url as this parameter. Else, set it to "" (in case of dataXML method). In this case, we're using Data.xml file, so we specify Data/Data.xml |
| strXML | If you intend to use dataXML method for this chart, pass the XML data as this parameter. Else, set it to "" (in case of dataURL method). Since we're using dataURL method, we specify this parameter as "". |
| chartId | Id for the chart, using which it will be recognized in the HTML page. Each chart on the page needs to have a unique Id. |
| chartWidth | Intended width for the chart (in pixels) |
| chartHeight | Intended height for the chart (in pixels) |
| debugMode | Whether to start the chart in debug mode. Please see Debugging your Chart Section for more details on Debug Mode. |
| registerWithJS | Whether to register the chart with JavaScript. Please see FusionCharts and JavaScript section for more details on this. |