FusionCharts allows you to export data from your charts in CSV format. The export of data can be triggered in two ways:
- Using the context menu of chart, which copies the generated CSV data to clipboard
- Using FusionCharts JavaScript API for data export, which returns the CSV data as string in your JavaScript code
Let's study both of them one by one.
To allow export of data using context menu, you need to specify the following in data:
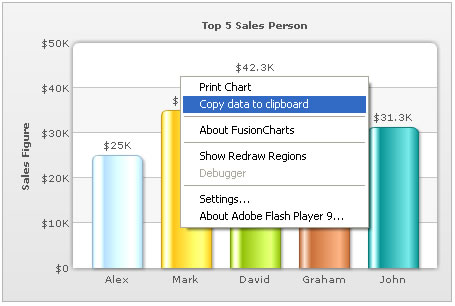
<chart yAxisName='Sales Figure' caption='Top 5 Sales Person' numberPrefix='$' useRoundEdges='1' showExportDataMenuItem='1'>
     <set label='Alex' value='25000'  />
     <set label='Mark' value='35000' />
     <set label='David' value='42300' />
     <set label='Graham' value='35300' />
     <set label='John' value='31300' />
  </chart>
{
"chart":{
"yaxisname":"Sales Figure",
"caption":"Top 5 Sales Person",
"numberprefix":"$",
"useroundedges":"1",
"showexportdatamenuitem":"1"
},
"data":[
{ "label":"Alex", "value":"25000" },
{ "label":"Mark", "value":"35000" },
{ "label":"David", "value":"42300" },
{ "label":"Graham", "value":"35300" },
{ "label":"John", "value":"31300" }
]
}
As soon as showExportDataMenuItem='1' is set in the chart, a new item is added to the chart's context menu, as shown below:
The label of this menu item can be customized by setting:
<chart ... exportDataMenuItemLabel='Copy the data of this chart' ...>
When you select this item, the data of this chart will be copied to your clipboard. If you open any text editor and paste the content of the clipboard, you'll get something as under:
"Label","Sales Figure"
"Alex","25000"
"Mark","35000"
"David","42300"
"Graham","35300"
"John","31300"
This is basically the CSV representation of your chart's data. In case of multi-series charts, the data will have more columns (one for each dataset). Let us next see how to format the output CSV data using various export related XML attributes that FusionCharts exposes.
You can customize the following aspects of the output CSV data:
- The separator character to be used for data. By default this is CSV.
- The qualifier character to be used. By default this is double quotes.
- Whether to output formatted data values (as shown on chart) in CSV, or raw values.
The following attributes help in configuring this:
| Attribute | Description | Example |
| exportDataSeparator | Lets you set the separator for CSV data. For ease of use, this attribute accepts the following pseudo codes for characters:
You can also specify any other character apart from these pseudo codes. |
exportDataSeparator='{tab}' |
| exportDataQualifier | Lets you set the qualifier character for CSV data. For ease of use, this attribute accepts the following pseudo codes for characters:
You can also specify any other character apart from these pseudo codes. |
exportDataQualifier='{quot}' |
| exportDataFormattedVal | Boolean value indicating whether to output formatted data values (as shown on chart) in the output CSV file. | exportDataFormattedVal='1' |
Data specified for the chart:
<chart caption='Country Comparison' showLabels='1' showvalues='0' decimals='0' numberPrefix='$' showExportDataMenuItem='1'>
      <categories>
         <category label='Austria' />
         <category label='Brazil' />
         <category label='France' />
         <category label='Germany' />
         <category label='USA' />
      </categories>
      <dataset seriesName='1996' color='AFD8F8' showValues='0'>
         <set value='25601.34' />
         <set value='20148.82' />
         <set value='17372.76' />
         <set value='35407.15' />
         <set value='38105.68' />
      </dataset>
      <dataset seriesName='1997' color='F6BD0F' showValues='0'>
         <set value='57401.85' />
         <set value='41941.19' />
         <set value='45263.37' />
         <set value='117320.16' />
         <set value='114845.27' />
      </dataset>
      <dataset seriesName='1998' color='8BBA00' showValues='0'>
         <set value='45000.65' />
         <set value='44835.76' />
           <set value='18722.18' />
           <set value='77557.31' />
           <set value='92633.68' />
        </dataset>
    </chart>
{
"chart":{
"caption":"Country Comparison", "showlabels":"1", "showvalues":"0", "decimals":"0", "numberprefix":"$", "showexportdatamenuitem":"1" },
"categories":[
{
"category":[
{ "label":"Austria" },
{ "label":"Brazil" },
{ "label":"France" },
{ "label":"Germany" },
{ "label":"USA" }
]
}
],
"dataset":[{ "seriesname":"1996", "color":"AFD8F8", "showvalues":"0",
"data":[
{ "value":"25601.34" },
{ "value":"20148.82" },
{ "value":"17372.76" },
{ "value":"35407.15" },
{ "value":"38105.68" }
]
},
{ "seriesname":"1997", "color":"F6BD0F", "showvalues":"0",
"data":[
{ "value":"57401.85" },
{ "value":"41941.19" },
{ "value":"45263.37" },
{ "value":"117320.16" },
{ "value":"114845.27" }
]
},
{ "seriesname":"1998", "color":"8BBA00", "showvalues":"0",
"data":[
{ "value":"45000.65" },
{ "value":"44835.76" },
{ "value":"18722.18" },
{ "value":"77557.31" },
{ "value":"92633.68" }
]
}
]
}
Corresponding CSV output:
"Label","1996","1997","1998"
"Austria","25601.34","57401.85","45000.65"
"Brazil","20148.82","41941.19","44835.76"
"France","17372.76","45263.37","18722.18"
"Germany","35407.15","117320.16","77557.31"
"USA","38105.68","114845.27","92633.68"
Here, since the XML didn't specify xAxisName attribute, "Label" has been put in CSV data as title for x-axis labels. The first line then contains series names of all the datasets present in the XML. Thereafter, each line of data first contains the x-axis label (category label) and value of each of those datasets for this label.
In the next section, we'll see how to access this data using JavaScript API.