You are viewing documentation for an older version. For current documentation - click here.

A thermometer gauge consists of the following elements:

Before going into the details of each of them, let’s have a look at a standard thermometer gauge enlisting the various basic components:


Thermometer Border and Fill

The fill level in a thermometer gauge helps the end user to decipher the value being illustrated. The thermometer can also have a border around it.

Tick Marks

Tick marks are the calibration marks on the vertical scale to the right of the thermometer to ease out the interpretation of the reading. There are two types of tick marks which can be drawn on the chart:

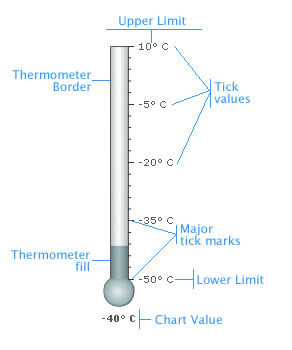
  • Major Tick Marks – These are the bigger lines on the tick mark scale.
  • Minor Tick Marks – These are the smaller lines enclosed within the bigger lines.

Value Display

The chart value display box displays the value of the thermometer fill.

Annotations

Annotations allow you to draw your own custom shapes, text, or load images on the chart. Now that we are aware of the basic components that make up a thermometer gauge, let's go ahead to build a sample thermometer gauge.