Here, we'll see how to configure the various facets of the chart. We'll see how to:
Let's see each of them one by one. |
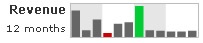
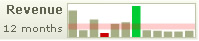
FusionWidgets XT spark column chart allows you to show period blocks on the chart using colored bands. This helps you easily interpret periods on the chart. For example, if we want to show 3 months period block on the chart, we can set: |
<chart ... periodLength='3' periodColor='CCCCCC' periodAlpha='50'>
{
  "chart": {
   ...
    "periodlength": "3",
    "periodcolor": "CCCCCC",
    "periodalpha": "50",

},
|
|
Here, we've set periodLength='3' as we've specified monthly data - so, 3 data points make 3 months. This will result in: |
 |
| |
| When specifying periods, you just need to make sure that your period length is always less than the number of data points that you've specified, as period length is directly numbered on data points. |
| |
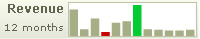
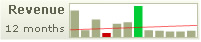
You can configure the chart to color the highest and lowest values in the chart using separate colors as shown below:
|
<chart ... highColor='00CC33' lowColor='CC0000' ...>
{
  "chart": {
   ...
    "highcolor": "00CC33",
    "lowcolor": "CC0000",
    ...
},
|
|
Here, we've asked the chart to color the column with highest in green and the one with lowest value in red. It will result in: |
 |
| |
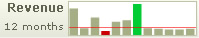
You can add trend-lines to spark column chart as under. For example, if we had wanted to show previous year's average revenue as a trend-line, we can add the following to XML: |
<chart ...>
<trendlines>
<line startvalue='215700' color='FF0000' thickness='1'/>
</trendlines>
</chart>
{
  "chart": {},

  ...

  "trendlines": [
    {
      "line": [
        {
          "startvalue": "215700",
          "color": "FF0000",
          "thickness": "1"
        }
      ]
    }
  ]
}
|
| |
| This will result in: |
| |
 |
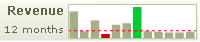
You can make this line appear as dashed using: |
<line startvalue='215700' color='FF0000' thickness='1' dashed='1' dashLen='3' dashGap='3' alpha='100'/>
 {
      "line": [
        {
          "startvalue": "215700",
          "color": "FF0000",
          "thickness": "1",;'
          "dashed": "1",
          "dashedlen": "3",
          "dashgap": "3",
          "alpha": "100",
        }
      ]
    }
|
|
This will result in:
|
 |
You can make slanted trend-lines using: |
<line startvalue='215700' endvalue='346400' color='FF0000' thickness='1'/>
{
      "line": [
        {
          "startvalue": "215700",
          "endvalue": "346400",
          "color": "FF0000",
          "thickness": "1",
         }
      ]
    }
|
|
This will result in: |
 |
Or, you can make the trend appear as a zone by setting: |
<line startvalue='215700' endvalue='396400' color='FF0000' thickness='1' isTrendZone='1'/>
{
      "line": [
        {
          "startvalue": "215700",
          "endvalue": "396400",
          "color": "FF0000",
          "thickness": "1",
          "istrendzone": "1"
         }
      ]
    }
|
|
This will result in:
|
 |