Starting FusionWidgets XT, charts/gauges can be rendered using JSON (JavaScript Object Notation) data. JSON is a light-weight and simple data format that is easy to read and understand. Though derived from JavaScript, the data structure is language-independent, with encoders and parsers available for virtually every programming language.
- JSON data is text based data consisting of key and value pairs in format key : value . The values have data associated with them
- You can make up your own key-value pairs like name : "John Doe" to store data
- Every JSON data is enveloped by curly brace and key:value pairs are comma separated, like { firstName : "John" , lastName: "Doe" }. In JavaScript, this format is called an Object
- A key can be a value within single or double-quotes e.g. { "name" : "John Doe" }
- You can use Objects as values too. For example, { "employee" : { "name" : "John Doe" , "department" : "Project Manager" , "age" : 35 } }
- In JSON, the basic data types are:
- Number (integer or real)
- String (double-quoted Unicode with backslash escaping)
- Boolean (1 or 0 in FusionCharts JSON)
- null
- Array (an ordered sequence of values of Number, String, Boolean, null, Object or Array type, comma-separated and enclosed in square brackets) e.g. [ "employees" : [ "Employees" , { "name" : "John Doe" } , 35 ]
- Object (a collection of key:value pairs, comma-separated and enclosed in curly braces. Value can be of Number, String, Boolean, null, Object or Array type) e.g. { "employee" : { "name" : "John Doe" , "department" : "Project Manager" , "age" : 35 } }
A FusionWidgets XT chart is controlled by a single JSON data source i.e., the same source contains data to plot, functional settings and cosmetic properties. There are many properties that you can define for each chart type. However, it is not necessary to define all the properties for a given chart. For example, if you do not want to change the default setting of the canvas (color, alpha etc.), you don't have to define any property for the canvas - the default values will be assumed. Thus, each chart can be generated using minimal properties.
In this page, we will discuss about how to use JSON data to create a Pyramid chart.
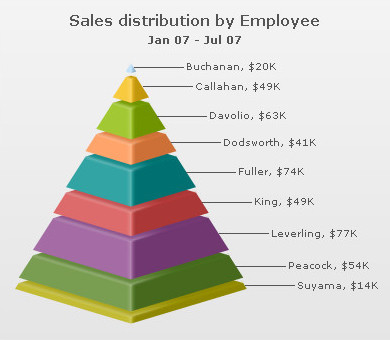
A sample JSON data for a Pyramid chart looks as under:
{
  "chart": {
    "caption": "Sales distribution by Employee",
    "subcaption": "Jan 07 - Jul 07",
    "numberprefix": "$",
    "issliced": "1"
  },
  "data": [
    {
      "label": "Buchanan",
      "value": "20000"
    },
    {
      "label": "Callahan",
      "value": "49000"
    },
    {
      "label": "Davolio",
      "value": "63000"
    },
    {
      "label": "Dodsworth",
      "value": "41000"
    },
    {
      "label": "Fuller",
      "value": "74000"
    },
    {
      "label": "King",
      "value": "49000"
    },
    {
      "label": "Leverling",
      "value": "77000"
    },
    {
      "label": "Peacock",
      "value": "54000"
    },
    {
      "label": "Suyama",
      "value": "14000"
    }
  ]
}
The chart Object defines all the settings that help to manipulate the chart. You can find the list of all the attributes for this Object in the XML Sheet of Pyramid chart.
In the most general form, chart attributes represent the following JSON format:
"attributeName" : "Value"
e.g., "caption" : "Sales distribution by Employee"
The attributes can be arranged in any order, with values either in single or in double quotes,
like caption:'Sales distribution by Employee'. However,
you need to make sure that a particular attribute occurs only once for
a given element.
Please note that the XML attributes declared in the XML Sheet for pyramid chart are same as the JSON keys in FusionWidgets XT JSON data format.
The data Array represents a set of data values which is to be plotted on the graph. The data Array contains a set of Objects, each representing a single pyramid slice.
{ "label: "Buchanan", "value" : "20000", "toolTip" : "Buchanan, 20000" }
The styles Object helps you apply font, effects and animations to various objects of the chart. In FusionWidgets XT JSON format, the styles Object contains two Arrays - definition and application. The definition Array contains a list of style Objects. Each style Object contains various style definition attributes. The application Array contains a list of apply Objects. Each apply Object contains attributes to apply styles that are defined in the definition Array to various chart objects.
To read more on Styles, please see Using Styles section.
Important: To use JSON data format with FusionWidgets XT, you'll need to embed the charts using FusionCharts JavaScript Class (FusionCharts.js), as the charts internally still use XML. The JavaScript class provides the bridge between JSON and XML.