To use message logger, you first need to make sure that you're using a real-time chart from FusionWidgets XT pack - i.e., charts which update themselves in real-time. Examples are real-time line chart, column chart, angular gauge, linear gauges etc.
Please note that Message Logger feature is not supported in JavaScript charts.
Thereafter, there are 2 steps involved in configuring and using the message logger:
- Configure your XML/JSON data to use message logger. Also, set up the XML attributes to configure the functional and cosmetic properties of the message logger.
- Configure your real-time data provider page to broadcast/stream messages to the logger.
We'll discuss both of these in details here.
To use the message logger in a real time chart, you just need to set the following in your XML:
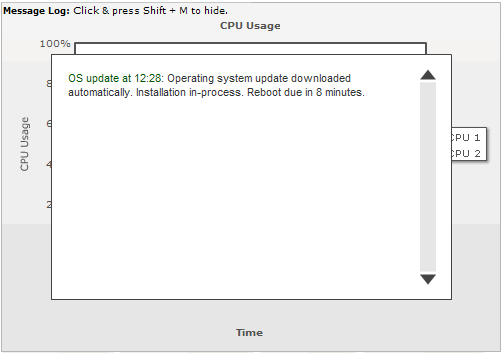
This attribute tells the chart to setup message logger and listen to messages streamed from the server. Please note that the message logger becomes visible only when it listens to the first message streamed from the server. By default, it stays in hidden mode.
So, for example, when you first set the message logger on for a real-time line chart, you will get a screen as under:
The following <chart> element attributes help you configure the functional and cosmetic properties of the message logger.
| Attribute Name | Type | Description |
| messageLogWPercent | Number (0-100) | This attribute lets you set the width percent of the message logger window w.r.t entire chart width. So, if you set it as 80, the message logger window will take up 80% of chart width. |
| messageLogHPercent | Number (0-100) | This attribute lets you set the height percent of the message logger window w.r.t entire chart height. |
| messageLogShowTitle | Boolean (0/1) | Whether to show the title for message logger? |
| messageLogTitle | String | If you've opted to show the title for message logger, you can define your custom title here. Examples are "Error log", "Server History" etc. The title displays at the top left corner of chart. |
| messageLogColor | Color (Hex without #) | You can customize the color of the entire message log window by setting a hex value for this attribute. |
| messageGoesToLog | Boolean (0/1) | The messages streamed to the chart can either be displayed in the message log window or can be passed to JavaScript (which we'll see next). This attribute lets you control whether the messages should be logged in the in-built log window. |
| messageGoesToJS | Boolean (0/1) | This attribute lets you configure whether each message streamed from the server should be passed to a local JavaScript function. |
| messageJSHandler | String | If you've opted to pass each message to JavaScript function, this attribute lets you define the name of the function. This helps you create your custom functions to react to messages streamed from server. |
| messagePassAllToJS | Boolean (0/1) | A message envelope contains a number of parameters like "Message ID, Message Title, Message Text and Message Type". Set this attribute to '1' to pass all the parameters of the message envelope to the custom JavaScript function. We'll see the implementation of this next. Note: The "messageGoesToJS" attribute is used to pass only the "Message Text" parameter to the JavaScript function, whereas, the "messagePassAllToJS" is used to pass all the four parameters to the JavaScript function. |
Now that the message logger is set up in the chart, we'll next see how to stream messages from server to the message logger.