Here, we'll see how to:
- Show/hide tick marks and tick values
- Configuring tick values
- Configuring tick marks & values position
- Configuring number of major and minor tick marks
- Configuring cosmetics
- Configuring tick mark & tick value padding
Let's see them one by one.
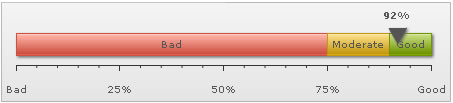
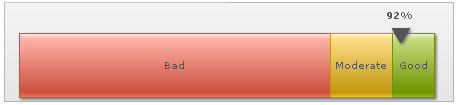
You can opt to hide both the tick marks and tick values using:
This will result in:
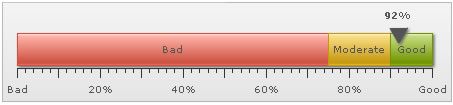
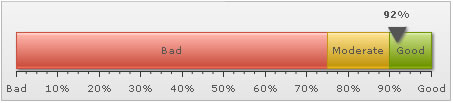
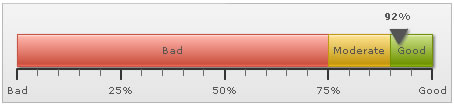
You can opt to show every nth tick value by setting:
This will result in every 2nd major tick mark's value being shown, as under:
You can also set the decimals for the tick values using:
Here, we've set tick value decimals as 2 and forced them to display. It will result in:

You can configure the ticks to show above/below the gauge using:
This results in:
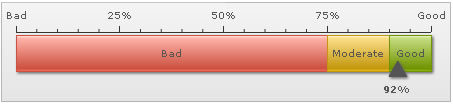
Additionally, you can opt to place the ticks/values inside/outside using:
You can configure the number of tick marks as under:
It will result in:
As you can see above, the chart has automatically adjusted the number of major ticks to a best feasible value. However, if you do not want the chart to do the same, you can add:
You can configure tick mark cosmetics using:
<chart ... majorTMColor='333333' majorTMAlpha='100' majorTMHeight='10' majorTMThickness='2' minorTMColor='666666' minorTMAlpha='100' minorTMHeight='7' minorTMThickness='1' ...>
{ "chart":{ "majortmcolor":"333333", "majortmalpha":"100", "majortmheight":"10", "majortmthickness":"2", "minortmcolor":"666666", "minortmalpha":"100", "minortmheight":"7",
   "minortmthickness":"1" } }
This will result in:
You can set tick mark and tick value padding using:
This results in: