Starting FusionWidgets XT, charts/gauges can be rendered using JSON (JavaScript Object Notation) data. JSON is a light-weight and simple data format that is easy to read and understand. Though derived from JavaScript, the data structure is language-independent, with encoders and parsers available for virtually every programming language.
- JSON data is text based data consisting of key and value pairs in format key : value . The values have data associated with them
- You can make up your own key-value pairs like name : "John Doe" to store data
- Every JSON data is enveloped by curly brace and key:value pairs are comma separated, like { firstName : "John" , lastName: "Doe" }. In JavaScript, this format is called an Object
- A key can be a value within single or double-quotes e.g. { "name" : "John Doe" }
- You can use Objects as values too. For example, { "employee" : { "name" : "John Doe" , "department" : "Project Manager" , "age" : 35 } }
- In JSON, the basic data types are:
- Number (integer or real)
- String (double-quoted Unicode with backslash escaping)
- Boolean (1 or 0 in FusionCharts JSON)
- null
- Array (an ordered sequence of values of Number, String, Boolean, null, Object or Array type, comma-separated and enclosed in square brackets) e.g. [ "employees" : [ "Employees" , { "name" : "John Doe" } , 35 ]
- Object (a collection of key:value pairs, comma-separated and enclosed in curly braces. Value can be of Number, String, Boolean, null, Object or Array type) e.g. { "employee" : { "name" : "John Doe" , "department" : "Project Manager" , "age" : 35 } }
A FusionWidgets XT gauge is controlled by a single JSON data source i.e., the same source contains data to plot, functional settings and cosmetic properties. There are many properties that you can define for each chart type. However, it is not necessary to define all the properties for a given chart. For example, if you do not want to change the default setting of the canvas (color, alpha etc.), you don't have to define any property for the canvas - the default values will be assumed. Thus, each chart can be generated using minimal properties.
In this page, we will discuss about how to use JSON data to create a Horizontal Linear gauge.
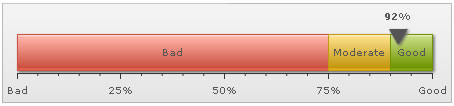
A sample JSON data for a Horizontal Linear gauge looks as under:
{
  "chart": {
    "lowerlimit": "0",
    "upperlimit": "100",
    "lowerlimitdisplay": "Bad",
    "upperlimitdisplay": "Good",
    "palette": "1",
    "numbersuffix": "%",
    "chartrightmargin": "20"
  },
  "colorrange": {
    "color": [
      {
        "minvalue": "0",
        "maxvalue": "75",
        "code": "FF654F",
        "label": "Bad"
      },
      {
        "minvalue": "75",
        "maxvalue": "90",
        "code": "F6BD0F",
        "label": "Moderate"
      },
      {
        "minvalue": "90",
        "maxvalue": "100",
        "code": "8BBA00",
        "label": "Good"
      }
    ]
  },
  "pointers": {
    "pointer": [
      {
        "value": "92"
      }
    ]
  }
}
The chart Object defines all the settings that help to manipulate the gauge. You can find the list of all the attributes for this Object in the XML Sheet of Horizontal Linear Gauge.
In the most general form, chart attributes represent the following JSON format:
"attributeName" : "Value"
e.g., "upperlimitdisplay" : "Good"
The attributes can be arranged in any order, with values either in single or in double quotes,
like upperlimitdisplay:'Good'. However,
you need to make sure that a particular attribute occurs only once for
a given element.
Please note that the XML attributes declared in the XML Sheet for Horizontal Linear Gauge are same as the JSON keys in FusionWidgets XT JSON data format.
Next comes the colorrange Object. The colorrange Object defines an array of color objects. The color objects are contained within the color Array. Each color object contains the color codes and the minimum and maximum values required to define the color range.
A typical color object looks like this:
{ "minvalue": "0", "maxvalue" : "75", "code" : "FF654F", "label": "Bad" }
Next, we have the pointers Object. The pointer Array defines the pointers on the gauge. Each element of this Array is an object that defines the value of the pointer through the value key as shown below:
"pointers": { "pointer": [ { "value": "92" } ] }
You can have multiple pointers on a single gauge. To have multiple pointers, just keep on adding new elements to the pointer Array with the required values.
Important: To use JSON data format with FusionWidgets XT, you'll need to embed the charts using FusionCharts JavaScript Class (FusionCharts.js), as the charts internally still use XML. The JavaScript class provides the bridge between JSON and XML.