Till now, we've only seen date based charts in all our examples. However, FusionWidgets XT Gantt chart also supports the following charts:
- Time based charts - For plotting tasks based on time - all occurring in a single day.
- Date + time based charts - To plot time based tasks spanning across multiple days.
Here, we'll see examples of both. But first, we'll see the XML format required for time based charts.
FusionWidgets XT needs you to specify the time necessarily in 24 hour format (hh:mn:ss) in your XML/JSON data.
The 24-hour clock is a convention of time-keeping in which the day runs from midnight to midnight and is divided into 24 hours, numbered from 0 to 23. A time of day is written in the 24-hour notation in the form hh:mm (for example 01:23) or hh:mm:ss (for example, 01:23:45), where hh (00 to 23) is the decimal number of full hours that have passed since midnight, mm (00 to 59) is the number of full minutes that have passed since the last full hour and ss (00 to 59) is the number of seconds since the last full minute. In the 24-hour time notation, the day begins at midnight, 00:00 and the last minute of the day is that beginning at 23:59.
So, to specify a time in FusionCharts XML, you'll have to use something as under:
or
In the above example, we've specified only the time. You can, however, specify both date and time, as we'll see later in this page.
Let's now quickly see an example of how to plot time based Gantt Charts.
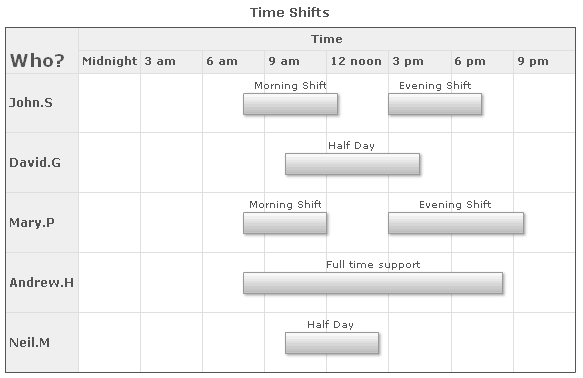
Here, we'll be plotting a time based Gantt chart to represent the time shifts for each employee. This chart's time span is 1 day only. Within that day, we'll distribute the chart into time blocks and show each employee's work time.
The final chart will look as under:

As you can see above, each employee's work time is now represented by a bar spanning across different times. We've also defined our own time base category (visual timeline) here.
The XML for this chart looks as under:
<chart dateFormat="dd/mm/yyyy" outputDateFormat="hh12:mn ampm" caption="Time Shifts">
  <categories>
    <category start="00:00:00" end="23:59:59" label="Time"/>
  </categories>
  <categories align="left">
    <category start="00:00:00" end="02:59:59" label="Midnight"/>
    <category start="03:00:00" end="05:59:59" label="3 am"/>
    <category start="06:00:00" end="08:59:59" label="6 am"/>
    <category start="09:00:00" end="11:59:59" label="9 am"/>
    <category start="12:00:00" end="14:59:59" label="12 noon"/>
    <category start="15:00:00" end="17:59:59" label="3 pm"/>
    <category start="18:00:00" end="20:59:59" label="6 pm"/>
    <category start="21:00:00" end="23:59:59" label="9 pm"/>
  </categories>
  <processes fontSize="12" isBold="1" align="left" headerText="Who?" headerFontSize="18" headerVAlign="bottom" headerAlign="left">
    <process label="John.S" id="EMP121"/>
    <process label="David.G" id="EMP122"/>
    <process label="Mary.P" id="EMP123"/>
    <process label="Andrew.H" id="EMP124"/>
    <process label="Neil.M" id="EMP125"/>
  </processes>
  <tasks showLabels="1">
    <task processId="EMP121" start="08:00:00" end="12:30:00" label="Morning Shift"/>
    <task processId="EMP121" start="15:00:00" end="19:30:00" label="Evening Shift"/>
    <task processId="EMP122" start="10:00:00" end="16:30:00" label="Half Day"/>
    <task processId="EMP123" start="08:00:00" end="12:00:00" label="Morning Shift"/>
    <task processId="EMP123" start="15:00:00" end="21:30:00" label="Evening Shift"/>
    <task processId="EMP124" start="08:00:00" end="20:30:00" label="Full time support"/>
    <task processId="EMP125" start="10:00:00" end="14:30:00" label="Half Day"/>
  </tasks>
</chart>
{
  "chart": {
    "dateformat": "dd/mm/yyyy",
    "outputdateformat": "hh12:mn ampm",
    "caption": "Time Shifts"
  },
  "categories": [
    {
      "category": [
        {
          "start": "00:00:00",
          "end": "23:59:59",
          "label": "Time"
        }
      ]
    },
    {
      "align": "left",
      "category": [
        {
          "start": "00:00:00",
          "end": "02:59:59",
          "label": "Midnight"
        },
        {
          "start": "03:00:00",
          "end": "05:59:59",
          "label": "3 am"
        },
        {
          "start": "06:00:00",
          "end": "08:59:59",
          "label": "6 am"
        },
        {
          "start": "09:00:00",
          "end": "11:59:59",
          "label": "9 am"
        },
        {
          "start": "12:00:00",
          "end": "14:59:59",
          "label": "12 noon"
        },
        {
          "start": "15:00:00",
          "end": "17:59:59",
          "label": "3 pm"
        },
        {
          "start": "18:00:00",
          "end": "20:59:59",
          "label": "6 pm"
        },
        {
          "start": "21:00:00",
          "end": "23:59:59",
          "label": "9 pm"
        }
      ]
    }
  ],
  "processes": {
    "fontsize": "12",
    "isbold": "1",
    "align": "left",
    "headertext": "Who?",
    "headerfontsize": "18",
    "headervalign": "bottom",
    "headeralign": "left",
    "process": [
      {
        "label": "John.S",
        "id": "EMP121"
      },
      {
        "label": "David.G",
        "id": "EMP122"
      },
      {
        "label": "Mary.P",
        "id": "EMP123"
      },
      {
        "label": "Andrew.H",
        "id": "EMP124"
      },
      {
        "label": "Neil.M",
        "id": "EMP125"
      }
    ]
  },
  "tasks": {
    "showlabels": "1",
    "task": [
      {
        "processid": "EMP121",
        "start": "08:00:00",
        "end": "12:30:00",
        "label": "Morning Shift"
      },
      {
        "processid": "EMP121",
        "start": "15:00:00",
        "end": "19:30:00",
        "label": "Evening Shift"
      },
      {
        "processid": "EMP122",
        "start": "10:00:00",
        "end": "16:30:00",
        "label": "Half Day"
      },
      {
        "processid": "EMP123",
        "start": "08:00:00",
        "end": "12:00:00",
        "label": "Morning Shift"
      },
      {
        "processid": "EMP123",
        "start": "15:00:00",
        "end": "21:30:00",
        "label": "Evening Shift"
      },
      {
        "processid": "EMP124",
        "start": "08:00:00",
        "end": "20:30:00",
        "label": "Full time support"
      },
      {
        "processid": "EMP125",
        "start": "10:00:00",
        "end": "14:30:00",
        "label": "Half Day"
      }
    ]
  }
}
Here, we've:
- First and very importantly defined the outputDateFormat attribute as hh12:mn ampm. This is necessary as we're using only time here. If you do not define this, the tooltip (or task date labels) will not show time.
- Defined 2 categories - first to represent the entire day (spanning from 00:00:00 to 23:59:59) and second to represent time blocks in multiples of 3 hours each. We've defined our own custom labels for each one of them. Also, we've set the alignment position of labels to the left for better visual clarity.
- Defined each employee as a process with its own ID.
- Created the task bars for each employee spanning the required time. Do remember to specify all time in the 24 hour format - else you'll see the task bars placed at weird positions in the chart.
If you're using only time based charts, FusionWidgets XT allows you to specify 23:59:59 as 24:00:00 for ease of usage.
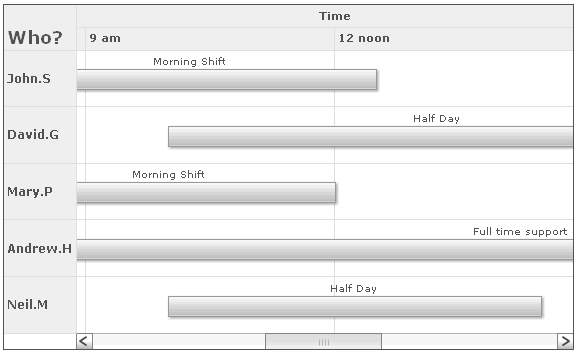
Let's now quickly modify this example to enable scrolling in Gantt pane. We'll set the scroll in such a way that the Gantt pane shows only 6 hours in a single view. To do so, we use:
This will result in:

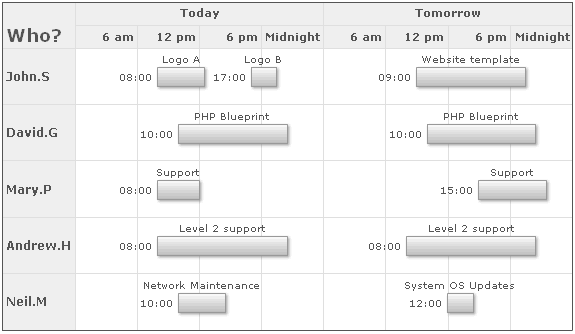
In this example, we'll plot time based Gantt charts that span more than a single day. We'll plot the work schedule of employees for the next 2 days.
The final chart will look as under after completion:

As you can see above, here we're spanning the task bars across 2 dates and different times in each date. To do so, we've to provide both the date and time to the chart in the following format:
or
The format is dd/mm/yyyy hh:mn:ss. You can customize dd/mm/yyyy to mm/dd/yyyy or yyyy/mm/dd using dateFormat attribute of <chart> element. But, the time always needs to be in hh:mn:ss format in 24 hour format.
The entire XML for above chart can be listed as under:
<chart dateFormat="mm/dd/yyyy" outputDateFormat="hh:mn" caption="Work Schedule" subCaption="For next 2 days">
  <categories>
    <category start="7/15/2007 00:00:00" end="7/15/2007 23:59:59" label="Today"/>
    <category start="7/16/2007 00:00:00" end="7/16/2007 23:59:59" label="Tomorrow"/>
  </categories>
  <categories align="right">
    <category start="7/15/2007 00:00:00" end="7/15/2007 05:59:59" label="6 am"/>
    <category start="7/15/2007 06:00:00" end="7/15/2007 11:59:59" label="12 pm"/>
    <category start="7/15/2007 12:00:00" end="7/15/2007 17:59:59" label="6 pm"/>
    <category start="7/15/2007 18:00:00" end="7/15/2007 23:59:59" label="Midnight"/>
    <category start="7/16/2007 00:00:00" end="7/16/2007 05:59:59" label="6 am"/>
    <category start="7/16/2007 06:00:00" end="7/16/2007 11:59:59" label="12 pm"/>
    <category start="7/16/2007 12:00:00" end="7/16/2007 17:59:59" label="6 pm"/>
    <category start="7/16/2007 18:00:00" end="7/16/2007 23:59:59" label="Midnight"/>
  </categories>
  <processes fontSize="12" isBold="1" align="left" headerText="Who?" headerFontSize="18" headerVAlign="bottom" headerAlign="left">
    <process label="John.S" id="EMP121"/>
    <process label="David.G" id="EMP122"/>
    <process label="Mary.P" id="EMP123"/>
    <process label="Andrew.H" id="EMP124"/>
    <process label="Neil.M" id="EMP125"/>
  </processes>
  <tasks showLabels="1" showStartDate="1">
    <task processId="EMP121" start="7/15/2007 08:00:00" end="7/15/2007 12:30:00" label="Logo A"/>
    <task processId="EMP121" start="7/15/2007 17:00:00" end="7/15/2007 19:30:00" label="Logo B"/>
    <task processId="EMP121" start="7/16/2007 09:00:00" end="7/16/2007 19:30:00" label="Website template"/>
    <task processId="EMP122" start="7/15/2007 10:00:00" end="7/15/2007 20:30:00" label="PHP Blueprint"/>
    <task processId="EMP122" start="7/16/2007 10:00:00" end="7/16/2007 20:30:00" label="PHP Blueprint"/>
    <task processId="EMP123" start="7/15/2007 08:00:00" end="7/15/2007 12:00:00" label="Support"/>
    <task processId="EMP123" start="7/16/2007 15:00:00" end="7/16/2007 21:30:00" label="Support"/>
    <task processId="EMP124" start="7/15/2007 08:00:00" end="7/15/2007 20:30:00" label="Level 2 support"/>
    <task processId="EMP124" start="7/16/2007 08:00:00" end="7/16/2007 20:30:00" label="Level 2 support"/>
    <task processId="EMP125" start="7/15/2007 10:00:00" end="7/15/2007 14:30:00" label="Network Maintenance"/>
    <task processId="EMP125" start="7/16/2007 12:00:00" end="7/16/2007 14:30:00" label="System OS Updates"/>
  </tasks>
</chart>
{
  "chart": {
    "dateformat": "mm/dd/yyyy",
    "outputdateformat": "hh:mn",
    "caption": "Work Schedule",
    "subcaption": "For next 2 days"
  },
  "categories": [
    {
      "category": [
        {
          "start": "7/15/2007 00:00:00",
          "end": "7/15/2007 23:59:59",
          "label": "Today"
        },
        {
          "start": "7/16/2007 00:00:00",
          "end": "7/16/2007 23:59:59",
          "label": "Tomorrow"
        }
      ]
    },
    {
      "align": "right",
      "category": [
        {
          "start": "7/15/2007 00:00:00",
          "end": "7/15/2007 05:59:59",
          "label": "6 am"
        },
        {
          "start": "7/15/2007 06:00:00",
          "end": "7/15/2007 11:59:59",
          "label": "12 pm"
        },
        {
          "start": "7/15/2007 12:00:00",
          "end": "7/15/2007 17:59:59",
          "label": "6 pm"
        },
        {
          "start": "7/15/2007 18:00:00",
          "end": "7/15/2007 23:59:59",
          "label": "Midnight"
        },
        {
          "start": "7/16/2007 00:00:00",
          "end": "7/16/2007 05:59:59",
          "label": "6 am"
        },
        {
          "start": "7/16/2007 06:00:00",
          "end": "7/16/2007 11:59:59",
          "label": "12 pm"
        },
        {
          "start": "7/16/2007 12:00:00",
          "end": "7/16/2007 17:59:59",
          "label": "6 pm"
        },
        {
          "start": "7/16/2007 18:00:00",
          "end": "7/16/2007 23:59:59",
          "label": "Midnight"
        }
      ]
    }
  ],
  "processes": {
    "fontsize": "12",
    "isbold": "1",
    "align": "left",
    "headertext": "Who?",
    "headerfontsize": "18",
    "headervalign": "bottom",
    "headeralign": "left",
    "process": [
      {
        "label": "John.S",
        "id": "EMP121"
      },
      {
        "label": "David.G",
        "id": "EMP122"
      },
      {
        "label": "Mary.P",
        "id": "EMP123"
      },
      {
        "label": "Andrew.H",
        "id": "EMP124"
      },
      {
        "label": "Neil.M",
        "id": "EMP125"
      }
    ]
  },
  "tasks": {
    "showlabels": "1",
    "showstartdate": "1",
    "task": [
      {
        "processid": "EMP121",
        "start": "7/15/2007 08:00:00",
        "end": "7/15/2007 12:30:00",
        "label": "Logo A"
      },
      {
        "processid": "EMP121",
        "start": "7/15/2007 17:00:00",
        "end": "7/15/2007 19:30:00",
        "label": "Logo B"
      },
      {
        "processid": "EMP121",
        "start": "7/16/2007 09:00:00",
        "end": "7/16/2007 19:30:00",
        "label": "Website template"
      },
      {
        "processid": "EMP122",
        "start": "7/15/2007 10:00:00",
        "end": "7/15/2007 20:30:00",
        "label": "PHP Blueprint"
      },
      {
        "processid": "EMP122",
        "start": "7/16/2007 10:00:00",
        "end": "7/16/2007 20:30:00",
        "label": "PHP Blueprint"
      },
      {
        "processid": "EMP123",
        "start": "7/15/2007 08:00:00",
        "end": "7/15/2007 12:00:00",
        "label": "Support"
      },
      {
        "processid": "EMP123",
        "start": "7/16/2007 15:00:00",
        "end": "7/16/2007 21:30:00",
        "label": "Support"
      },
      {
        "processid": "EMP124",
        "start": "7/15/2007 08:00:00",
        "end": "7/15/2007 20:30:00",
        "label": "Level 2 support"
      },
      {
        "processid": "EMP124",
        "start": "7/16/2007 08:00:00",
        "end": "7/16/2007 20:30:00",
        "label": "Level 2 support"
      },
      {
        "processid": "EMP125",
        "start": "7/15/2007 10:00:00",
        "end": "7/15/2007 14:30:00",
        "label": "Network Maintenance"
      },
      {
        "processid": "EMP125",
        "start": "7/16/2007 12:00:00",
        "end": "7/16/2007 14:30:00",
        "label": "System OS Updates"
      }
    ]
  }
}
Here, we've:
- First and very importantly defined the outputDateFormat attribute as hh:mn so that we see only time on the chart and no dates.
- Defined 2 categories - first to represent the two days day (each spanning from 00:00:00 to 23:59:59) and second to represent time blocks in multiples of 6 hours each. We've defined our own custom labels for each one of them. Also, we've set the alignment position from right to left for better visual clarity.
- Defined each employee as a process with its own ID.
- Created the task bars for each employee spanning the required date & time. Do remember to specify all time in the 24 hour format - else you'll see the task bars placed at weird positions in the chart.