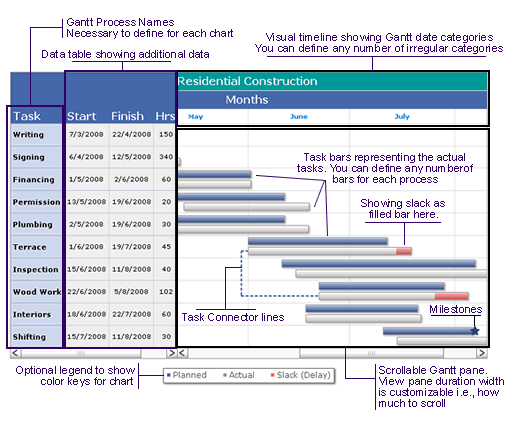
FusionWidgets XT Gantt chart consists of the following elements:
- Categories and sub-categories (dates) in the visual time line
- Scrollable data table consisting of:
- Scrollable Gantt view pane consisting of:
- Optional legend to show color keys used in the chart.
Here we’ll see each of them in detail. Let’s first have a look at a standard Gantt chart enlisting a few of the above elements:

A Gantt chart is constructed with a horizontal axis representing the total time span of the project, broken down into increments (for example, days, weeks, or months). FusionWidgets XT Gantt chart allows you to define any number of sub-categories to show dates broken into smaller units.
For example, if you were to show a Gantt Chart spanning 2 years, you can show the first sub-category as quarters, then divide these quarters into months, then weeks and finally into days. This is all possible with FusionWidgets XT Gantt Chart.
Irregular distribution of the timeline is also possible. For example, if you want to plot a Gantt chart illustrating the development of a certain project during a time span of 3 months and you want to show weekly progress, you can easily divide the time period into weeks based on their actual dates to show the true progress. In the visual date timeline, the top bar could represent the 3 months by their names and the bar below it could display the weeks.
In most of the other Gantt charts, you’re forced to divide a month into 4 weeks only, thereby resulting to aberrations in visual data display, as a month always is more than 4 weeks. But since FusionWidgets XT Gantt chart is date based, all your divisions of date are perfect. You can therefore show a week starting in one month and ending in other.
Each task in a Gantt chart is represented as a process. For example, in the chart above, we've the processes as "Writing", "Signing", "Financing" etc. Whenever you build a Gantt chart using FusionWidgets XT, you need to specify the process names and then specify the tasks within process names.
The process names show up in a scrollable data table to the left of Gantt pane.
Milestones are an important part of the Gantt chart as they allow you to visually depict any crucial dates on the chart. FusionWidgets XT allows you to create your own milestones on the chart based on date and task, i.e., for a given task you can specify milestones on specific dates and you can customize all the visual properties of the milestone including shape (star or polygon), size and colors.
Additionally, you can add tool text and link for the milestone.
FusionWidgets XT Gantt chart allows you to draw connectors between your task bars to indicate the flow of the entire process.
On the functional side, to draw a connector, all you need to do is specify the Id of the two tasks, which you want to connect. Apart from this, you can also specify where the connector joins the start and end task bar individually – at their start or end.
For example, if you need to plot two connecting tasks which are simultaneous in nature, that is each process starts at the same time and relates to the same thing, you can connect the start of task bar to the start of end bar to give the visual effect. Similarly, if the second process can start only after the first process has ended, you can connect the end of first task bar to the start of succeeding task bar.