Instead of using simple links, you can also set JavaScript links using FusionWidgets XT. That is, you can invoke a JavaScript function present in the same page (in which the chart is present) when the end viewer clicks a data element on the chart.
FusionWidgets XT provides two ways of set JavaScript functions as links:
- J- Prefix : Just place the function name after the j- notation. The function will be evaluated as a standard JavaScript function and anything placed after the function name separated by a - (dash) will be passed as a single String parameter to the function. e.g.,
<set label='USA' value='235' link="j-myJS-USA,235"/>
 "data": [
    {
      "label": "USA",
      "value": "235",
      "link": "j-myJS-USA,235"
    }
  ]
In the above code snippet, myJS refers to a custom JavaScript function present in the HTML page that embeds this chart and USA,235 is the parameter value passed to the function. You can pass only a single string parameter to this function. When you now click the data item (funnel, pyramid, etc.) for this particular data, myJS function will be invoked and 'USA, 235' will be passed to the function as the function parameter. Here, we've passed the data label and value just for demonstration purposes. In actual charts, you can pass identifier numbers or strings of each data. When the user clicks on the link, these identifiers can be sent back to your JavaScript function for further actions (like loading detailed data for that identifier using AJAX or anything - the possibilities are endless).
- JavaScript: prefix : provide single or multiple JavaScript functions or statements after JavaScript: prefix. e.g.,
<set label='USA' value='235' link="JavaScript: isJavaScriptCall=true; alert('hi JS!'); myJS('USA',235);"/>"data": [ { "label": "USA", "value": "235", "link": "JavaScript: isJavaScriptCall=true; alert('hi JS!'); myJS('USA',235);" } ]
In the above code snippets, we have set the value of variable isJavaScriptCall to true. Next, we call JavaScript alert. Finally, we call myJS which refers to a custom JavaScript function present in the HTML page that embeds this chart. You can also specify any number of parameters for this function. When you now click the data item (funnel, pyramid, etc.) for this particular data, myJS function will be invoked and 'USA' will be passed as the first parameter (string) and 235 will be passed as second parameter (numeric) to the function.
Advanced Note: Syntax of JavaScript links having J- prefix
j-{user function name}-{parameter}
The {user function name} is a user-defined function. It will receive the parameters as a single de-limiter separated string.
The {parameters} is a de-limiter separated value field. The parameter field should not be enclosed within quotes. Using this method, you can just pass one parameter from chart to your JavaScript. So, when you need to pass multiple parameters, combine them using a delimiter in XML, and then in your JavaScript method split it again.
The classical notation will be evaluated faster since no String decomposition takes place. However, the new syntax removes all the problems with nested quotation marks.
Let's quickly put up an example for these kind of links. We'll create a simple <chart name> chart indicating "ABC Bank Branches" in Asia. Each <data plot> when clicked will pass its label and value to our custom JavaScript function myJS, which (for the sake of demonstration) will just write it out in an alert box.
We create JSExample.html for this example in Drill-Down folder. It contains the following HTML code:
<html>
  <head>
    <title>JavaScript Link Example</title>
    <script language="JavaScript" src="../Charts/FusionCharts.js"></script>
    <script language="JavaScript"><!--
      function myJS(myVar){
          window.alert(myVar);
      }
    // -->
   </script>
  </head>
  <body bgcolor="#ffffff">
    <div id="chartdiv" align="center">The chart will appear within this DIV. This text will be replaced by the chart.</div>
    <script type="text/javascript"><!--
        var myChart = new FusionCharts("../Charts/<chart name>.swf",
        "myChartId", "500", "300", "1",
        "1");
       myChart.setXMLUrl("JSExample.xml");
       myChart.render("chartdiv");
    // -->
	</script>
  </body>
</html>
See it live!
Here, we've a defined a function myJS which will respond to the clicks generated from the chart.
Let's see how the function can be called using the two methods of defining JavaScript links:
And now, JSExample.xml looks as under:
<chart caption="ABC Bank Branches" subCaption="(In
      Asian Countries)" yaxislabel="Branches" xaxislabel="Country">
  <set label="Hong Kong" value="235" link="j-myJS-Hong Kong, 235"/>
  <set label="Japan" value="123" link="j-myJS-Japan, 123"/>
  <set label="Singapore" value="129" link="j-myJS-Singapore, 129"/>
  <set label="Malaysia" value="121" link="j-myJS-Malaysia, 121"/>
  <set label="Taiwan" value="110" link="j-myJS-Taiwan, 110"/>
  <set label="China" value="90" link="j-myJS-China, 90"/>
  <set label="S. Korea" value="86" link="j-myJS-S.Korea, 86"/>
</chart>
{
  "chart": {
    "caption": "ABC Bank Branches",
    "subcaption": "(In        Asian Countries)",
    "yaxislabel": "Branches",
    "xaxislabel": "Country"
  },
  "data": [
    {
      "label": "Hong Kong",
      "value": "235",
      "link": "j-myJS-Hong Kong, 235"
    },
    {
      "label": "Japan",
      "value": "123",
      "link": "j-myJS-Japan, 123"
    },
    {
      "label": "Singapore",
      "value": "129",
      "link": "j-myJS-Singapore, 129"
    },
    {
      "label": "Malaysia",
      "value": "121",
      "link": "j-myJS-Malaysia, 121"
    },
    {
      "label": "Taiwan",
      "value": "110",
      "link": "j-myJS-Taiwan, 110"
    },
    {
      "label": "China",
      "value": "90",
      "link": "j-myJS-China, 90"
    },
    {
      "label": "S. Korea",
      "value": "86",
      "link": "j-myJS-S.Korea, 86"
    }
  ]
}
As you can see above, for each data item, we've defined a JavaScript link that points to the custom function myJS. To this function, we're passing the name and value of the data item.
When you view the chart and click on a column, you'll see something like under:
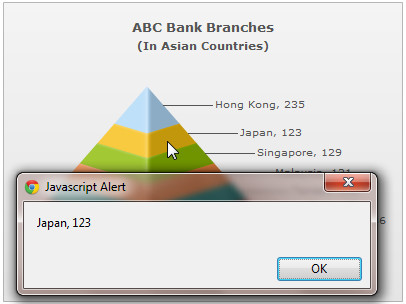
See it live!
Note: The above mentioned way of using JavaScript functions as links is supported by all the major browsers.
Using this method, the JSExample.xml will look like this:
<chart caption="ABC Bank Branches" subCaption="(In
      Asian Countries)" yaxislabel="Branches" xaxislabel="Country">
  <set label="Hong Kong" value="235" link="JavaScript:myJS('Hong Kong,235');"/>
  <set label="Japan" value="123" link="JavaScript:myJS('Japan, 123');"/>
  <set label="Singapore" value="129" link="JavaScript:myJS('Singapore, 129');"/>
  <set label="Malaysia" value="121" link="JavaScript:myJS('Malaysia, 121');"/>
  <set label="Taiwan" value="110" link="JavaScript:myJS('Taiwan, 110');"/>
  <set label="China" value="90" link="JavaScript:myJS('China, 90');"/>
  <set label="S. Korea" value="86" link="JavaScript:myJS('S.Korea, 86');"/>
</chart>
{
  "chart": {
    "caption": "ABC Bank Branches",
    "subcaption": "(In        Asian Countries)",
    "yaxislabel": "Branches",
    "xaxislabel": "Country"
  },
  "data": [
    {
      "label": "Hong Kong",
      "value": "235",
      "link": "JavaScript:myJS('Hong Kong,235');"
    },
    {
      "label": "Japan",
      "value": "123",
      "link": "JavaScript:myJS('Japan, 123');"
    },
    {
      "label": "Singapore",
      "value": "129",
      "link": "JavaScript:myJS('Singapore, 129');"
    },
    {
      "label": "Malaysia",
      "value": "121",
      "link": "JavaScript:myJS('Malaysia, 121');"
    },
    {
      "label": "Taiwan",
      "value": "110",
      "link": "JavaScript:myJS('Taiwan, 110');"
    },
    {
      "label": "China",
      "value": "90",
      "link": "JavaScript:myJS('China, 90');"
    },
    {
      "label": "S. Korea",
      "value": "86",
      "link": "JavaScript:myJS('S.Korea, 86');"
    }
  ]
}
As you can see above, for each data item, we used JavaScript:, instead of j-, which points to the custom function myJS, and the function call is written exactly with as in JavaScript notation. Apart from this, everything else remains same.
Note: Internally the chart decodes a URL that you set as link. Before invoking the link it again encodes the URL. If you are passing multilingual characters via a URL or do not want this decode-encode mechanism to be handled by the chart you can set unescapeLinks='0' in <chart> element of the chart's XML data. If you are using JSON data, you need to use { "chart" : { "unescapeLinks" : "0" ... } ... } .