FusionWidgets XT uses FusionCharts JavaScript Class that takes care of all the products of FusionCharts XT Suite including FusionWidgets XT.
FusionCharts JavaScript class provides a developer-friendly mechanism to debug charts. You can debug your charts in three ways:
- Use the FusionCharts JS Library’s internal debugMode to watch chart’s activities
- Know the error code and possible cause of an error
- Write your own functions to trap specific error events raised by FusionCharts
Using the FusionCharts JavaScript Debug Mode
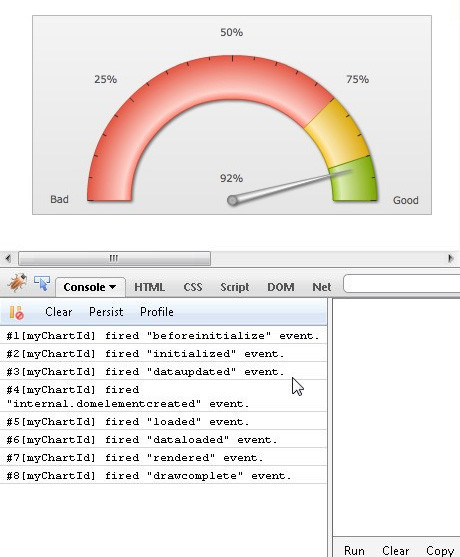
FusionCharts JavaScript Class has its own debugMode. This allows users to watch the chart’s JS activities and debug charts accordingly. To enable the JavaScript Debug Mode, you need to write the following lines of code:
FusionCharts.debugMode.enabled(true);
Next, you need to specify where you will like to display the debugMode output. In case you want to see the error within the browser’s JavaScript console, you need to write the following lines of code.
FusionCharts.debugMode.outputTo( function() { console.log(arguments); } );
The above line of code will output the debugMode messages somewhat as below:
See it live!
Note that, depending upon your browser, you may need to specifically enable “JavaScript Console”.
In case, you want detailed information regarding each event, you may use a more advanced JavaScript debugger such as FireBug (available for FireFox) or FireBug-Lite (can be used on most browsers).
If you are using an advanced JavaScript console (like Firebug) that can display object hierarchy, you may want to change the debugMode output format.To set the output format to ‘verbose’, use the following line of code:
FusionCharts.debugMode.outputFormat('verbose');
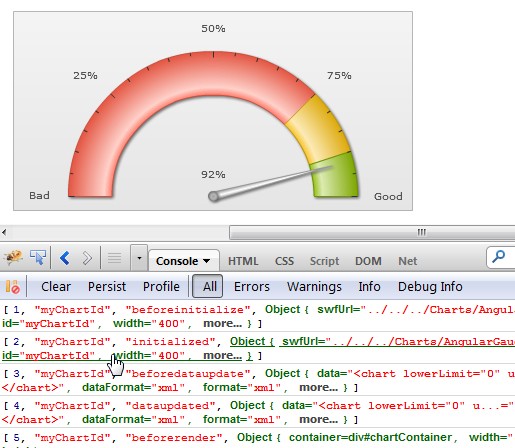
See it live!
All the above lines can be written in one compact line of code:
FusionCharts.debugMode.enabled( function() { console.log(arguments); }, 'verbose');
The supported debugMode output formats are: text (default), verbose and event. When the outputFormat is set to event, the output function assigned to the debugger (using debugMode.outputTo method) is sent arguments exactly matching FusionCharts Advanced events model: eventObject, argumentsObject.
FusionCharts.debugMode._enableFirebugLite();
This method takes time for the console to load (also needs internet connectivity) as the Firebug script is remotely loaded.
In case you have a local copy of Firebug-lite, simply pass the path to the script as a parameter of the above function:
FusionCharts.debugMode._enableFirebugLite('firebug-lite.js');See it live!
FusionCharts JavaScript Class displays or logs errors messages when an error occurs while rendering a chart. The error message contains an error code.
The table below contains the list of Error codes and the description of each error.
| Error Code | Nature | Description |
| 25081429 | param | Invalid parameters passed to the getChartAttribute() function. |
| 25081543 | param | Invalid parameters passed to the getChartData() function. Check whether you are specifying one of the valid data-format strings. |
| 25081617 | run | Call to a particular method on Flash chart (ExternalInterface function) failed. Check whether the chart has been rendered or whether you have proper Flash Player Security settings. |
| 25081621 | run | This is an error caused when FusionCharts Flash object is sending data to non-existent object while accessing flashVars. This happens when a chart has been disposed from JavaScript, but due to manipulations by any other external script, the chart's HTMLNode is not deleted from the DOM. |
| 25081627 | param | Invalid parameters (null, undefined, etc.) passed to the setDataXML() function. |
| 25081724 | param | Invalid parameters (null, undefined, etc.) passed to the function setDataURL() |
| 25081731 | param | Invalid parameters (null, undefined, etc.) passed to the configureLink() function. |
| 25081803 | Runtime | Canvas text drawing is not supported in browser. This error occurs when Print Manager is activated. Make sure you are not using a very old browser version that does not have full support for HTML5 canvas. |
| 25081807 | Runtime | There was an error while drawing text on canvas.This error occurs when Print Manager is activated. Make sure you are not using a very old browser version that does not have full support for HTML5 canvas. |
| 25081810 | Runtime | There was an error while drawing canvas.This error occurs when Print Manager is created image. Make sure you are not using a very old browser version that does not have full support for HTML5 canvas. |
| 25081816 | Runtime | printManager is not compatible with your browser. This error occurs when Print Manager is enabled. Make sure you are not using a very old browser version that does not have support for HTML5 canvas. |
| 25081731 | param | An invalid value was specified for renderer-name. Make sure you are using one of the valid renderer name strings while using the setCurrentRenderer() function or while specifying "renderer" parameter during FusionCharts construction. |
| 25081733 | type | An invalid data type was specified for renderer-name. Make sure you are not sending undefined or null to the setCurrentRenderer() function or to "renderer" parameter while FusionCharts construction. |
| 25081840 | run | An invalid value was specified for renderer-name. Make sure you are using one of the valid renderer name strings while using the setCurrentRenderer() function or while specifying "renderer" parameter during FusionCharts construction. |
| 25081843 | param | Missing required parameter swfUrl while creating a new FusionCharts object. |
| 25081845 | run | No active renderer. This is a critical error. Try hard-specifying the renderer name using the setCurrentRenderer() method. |
| 25081850 | run | Error rendering chart. This is possibly caused when there is an issue while accessing the chart container HTMLNode element. |
| 25081843 | comp | IECompatibility variable naming error. This error occurs when you have a JavaScript variable in the global window scope with the same name as that of the chart's Id. For example: var myChart = new FusionCharts('Pyramid.swf', 'myChart'); Note that the chart id "myChart" is same as the JS variable name "myChart" |
| 03091549 | param | Unspecified event type specified to the parameter of addEventListener() function. Refer to Event API reference for valid event names. |
| 03091550 | param | Invalid event type specified to the parameter of removeEventListener() function. Refer to Event API reference for valid event names. |
| 03091559 | param | Invalid event type specified to the parameter of removeEventListener() function. Refer to Event API reference for valid event names. |
| 03091560 | param | Unrecognized event type provided to the removeEventListener() function. Refer to Event API reference for valid event names. |
| 03091602 | param | Invalid event type (null, undefined, etc.) provided while event manager raises an event. |
| 03091609 | param | Invalid parameters passed to the setChartDataUrl() function. Check whether you are specifying one of the valid data-format strings. |
| 03091610 | param | Invalid parameters passed to the setChartData() function. Check whether you are specifying one of the valid data-format strings. |
| 03091611 | param | Invalid parameters passed to the setChartData() function. Check whether you are specifying one of the valid data-format strings. |
There are three error events which can be listened to using simple event listening. They are described as follows:
- FC_NoDataToDisplay : This event is fired when the XML data loaded by chart didn't contain any data to display. It can be used to show an error message to user, or to take a corrective measure.
- FC_DataLoadError : This event is fired when there was an error in loading data from the specified Url. It can be used to show an error message to user, or to take a corrective measure.
- FC_DataXMLInvalid : This event is fired when the XML data loaded by chart is invalid. It can be used to show an error message to user, or to take a corrective measure.
To know more on how to listen to simple events like the ones listed above read FusionCharts and JavaScript > Listening to events page.
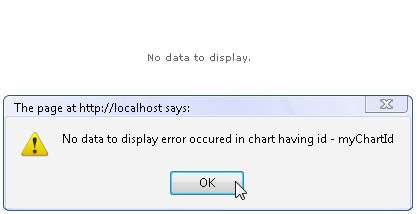
The image and the code below shows how NoDataToDisplay error is listened to and shown an alert message when the event is fired:
<html>
  <head>
    <title>Listening to simple error event NoDataToDisplay</title>
    <script type="text/javascript" src="../../FusionCharts/FusionCharts.js" ></script>
  </head>
  <body>
    <div id="chartContainer">FusionCharts will load here </div>

	  <script type="text/javascript"><!--

		  var myChart = new FusionCharts("../../Charts/AngularGauge.swf", "myChartId", "400", "200", "0", "1");
		  myChart.setXMLData("<chart/>");
		  myChart.render("chartContainer");

			function FC_NoDataToDisplay(DOMId)
			{
				alert("No data to display error occurred in chart having id - " + DOMId);
			}
		  // -->
	  </script>
  </body>
</html>
In the above code, we have created a chart and set an empty XML with just the root element <chart/>. This makes the XML devoid of any chart data.
Hence, the error event FC_NoDataToDisplay is being fired. We listen to that event declaring a function of the same name. The function gets automatically called by the chart in this case. We show an alert message when the function is called.
See this example live!
FusionCharts JavaScript Class provides two error events.
- Error
- Warning
You can listen to the above events globally or on a per-chart basis. To listen to an error event globally, use the following line of code:
FusionCharts.addEventListener('Error', function (eventObject, argumentsObject) {
   alert('There was an error with  charts!\n' + argumentsObject.message);
});
You can also use the legacy simple event method:
function FC_Error(eventObject, argumentsObject) {
  alert('There was an error with  charts! \n' + argumentsObject.message);
}
The arguments of the event are:
- id: string – the error id
- nature: string – the category of error ( nature can be TypeException, ValueRangeException, NotImplementedException, ParameterException, RuntimeException, designTimeError or UnspecifiedException )
- source: string – source/module where the error occurred
- message: string – error message
To know more on events and listening to the events read FusionCharts and JavaScript > Listening to Events page.