You are viewing documentation for an older version. For current documentation - click here.
 Real-time Column Chart Specification Sheet
 SWF: RealTimeColumn.swf

Quick Links (within this page)
 Chart  Data  Others
 Chart Image
 Chart Objects
 Functional Attributes
 Titles and Axis Names
 Chart Cosmetics
 Real-time properties
 Chart Y-Axis
 Chart Labels & Values
 Canvas Cosmetics
 Divisional Lines/Grids
 Legend
 Zero Plane properties
 Sample XML Data
 <categories> element
 <category> element
 <dataset> element
 <set> element
 Plot (column) properties
 Number Formatting
 Font Properties
 Vertical Lines
 Tooltip
 Paddings and Margins
 Message Logger
 <trendlines> --> <line> element

 Real-time Column chart looks as under:
Real-time Column

 Sample XML / JSON for Real-time Column Chart:

Note: Data for real-time charts are provided by a data provider. Hence, the data values of the real-time chart may not available in XML/JSON. However, the XML/JSON contains the cosmetics and functional properties for the chart along with blank dataset and categories.

<chart caption="Concurrent Users" borderColor="899FB6" subcaption="(Refreshes every 3 seconds)" canvasborderColor="DAE1E8" canvasBgColor="FFFFFF" bgColor="EEF2FB" numDivLines="6" divLineColor="DAE1E8" divLineAlpha="75" alternateHGridAlpha="30" decimals="0" baseFontColor="899FB6" outCnvBaseFontColor="444C60" toolTipBorderColor="DAE1E8" toolTipBgColor="FFFFFF" toolTipSepChar=" " showAlternateHGridColor="1" alternateHGridColor="DAE1E8" dataStreamURL="DataProviders/RealTimeColumn1.asp" refreshInterval="3" numDisplaySets="15" showLegend="1" showLabels="1" showRealTimeValue="1" labelDisplay="none" showShadow="1" showPlotBorder="0" plotBordercolor="FFFFFF" plotGradientColor="" labelStep="2" canvasLeftMargin="50">
  <categories/>
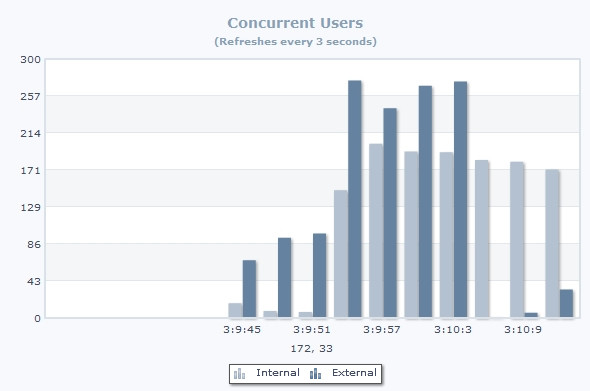
  <dataSet color="B3C1D0" seriesName="Internal" showValues="0"/>
  <dataSet color="6582A0" seriesName="External" showValues="0"/>
</chart>
{
"chart": {
"caption": "Concurrent Users",
"bordercolor": "899FB6",
"subcaption": "(Refreshes every 3 seconds)",
"canvasbordercolor": "DAE1E8",
"canvasbgcolor": "FFFFFF",
"bgcolor": "EEF2FB",
"numdivlines": "6",
"divlinecolor": "DAE1E8",
"divlinealpha": "75",
"alternatehgridalpha": "30",
"decimals": "0",
"basefontcolor": "899FB6",
"outcnvbasefontcolor": "444C60",
"tooltipbordercolor": "DAE1E8",
"tooltipbgcolor": "FFFFFF",
"tooltipsepchar": " ",
"showalternatehgridcolor": "1",
"alternatehgridcolor": "DAE1E8",
"datastreamurl": "DataProviders/RealTimeColumn1.asp",
"refreshinterval": "3",
"numdisplaysets": "15",
"showlegend": "1",
"showlabels": "1",
"showrealtimevalue": "1",
"labeldisplay": "none",
"showshadow": "1",
"showplotborder": "0",
"plotbordercolor": "FFFFFF",
"plotgradientcolor": "",
"labelstep": "2",
"canvasleftmargin": "50"
},
"categories": [
{}
],
"dataset": [
{
"color": "B3C1D0",
"seriesname": "Internal",
"showvalues": "0"
},
{
"color": "6582A0",
"seriesname": "External",
"showvalues": "0"
}
]
}
Back to top Back to Top

Chart Objects

Custom defined Styles can be applied to the chart objects listed below. The table contains the names of the chart objects, short descriptions, list of supported Styles and list of supported animation parameters.

Object Name Description Features Supported Animation Parameters Supported
BACKGROUND Background refers to the background for entire chart.
  • Animation
  • Shadow
  • Glow
  • Bevel
  • Blur
  • _alpha
  • _x
  • _y
  • _xScale
  • _yScale
CANVAS The entire area inside which the chart is plotted.
  • Animation
  • Shadow
  • Glow
  • Bevel
  • Blur
  • _alpha
  • _x
  • _y
  • _xScale
  • _yScale
CAPTION Caption of the chart.
  • Animation
  • Font
  • Shadow
  • Glow
  • Bevel
  • Blur
  • _alpha
  • _x
  • _y
SUBCAPTION Sub-caption of the chart.
  • Animation
  • Font
  • Shadow
  • Glow
  • Bevel
  • Blur
  • _alpha
  • _x
  • _y
XAXISNAME X-axis label of the chart.
  • Animation
  • Font
  • Shadow
  • Glow
  • Bevel
  • Blur
  • _alpha
  • _x
  • _y
YAXISNAME Y-axis label of the chart.
  • Animation
  • Font
  • Shadow
  • Glow
  • Bevel
  • Blur
  • _alpha
  • _x
  • _y
DATAPLOT Columns on the chart.
  • Animation
  • Shadow
  • Glow
  • Bevel
  • Blur
  • _alpha
  • _x
  • _y
  • _xScale
  • _yScale
DATALABELS X-axis labels of the chart.
  • Animation
  • Font
  • Shadow
  • Glow
  • Bevel
  • Blur
  • _alpha
  • _x
  • _y
DATAVALUES Data value for each column.
  • Animation
  • Font
  • Shadow
  • Glow
  • Bevel
  • Blur
  • _alpha
  • _x
  • _y
DIVLINES Horizontal lines running through the canvas. Each divisional line signifies a smaller unit of the entire axis thus aiding the users in interpreting the chart.
  • Animation
  • Shadow
  • Glow
  • Bevel
  • Blur
  • _alpha
HGRID HGRID refers to alternate color bands between two successive horizontal divisional lines.
  • Animation
  • Shadow
  • Glow
  • Bevel
  • Blur
  • _alpha
YAXISVALUES YAXISVALUES refers to the limit values or divisional line values, which are displayed along the y-axis of the chart.
  • Animation
  • Font
  • Shadow
  • Glow
  • Bevel
  • Blur
  • _alpha
  • _x
  • _y
REALTIMEVALUE If you've opted to show the real-time value on the chart, REALTIMEVALUE object represents that text field.
  • Animation
  • Font
  • Shadow
  • Glow
  • Bevel
  • Blur
  • _alpha
  • _x
  • _y
TRENDLINES TRENDLINES refer to horizontal lines spanning the chart canvas which aid in interpretation of data with respect to some pre-determined value.
  • Animation
  • Shadow
  • Glow
  • Bevel
  • Blur
  • _alpha
TRENDVALUES TRENDVALUES refer to the display values of trend-lines (if any).
  • Animation
  • Font
  • Shadow
  • Glow
  • Bevel
  • Blur
  • _alpha
  • _x
  • _y
VLINES VLINES are vertical separator lines that help you separate blocks of data. These lines run through the height of the chart, thereby segregating data into different blocks.
  • Animation
  • Shadow
  • Glow
  • Bevel
  • Blur
  • _alpha
VLINELABELS Labels of the vertical line
  • Animation
  • Font
  • Shadow
  • Glow
  • Bevel
  • Blur
  • _alpha
  • _x
  • _y
TOOLTIP Tooltip for the chart.
  • Font
 
LEGEND Legend for the chart.
  • Animation
  • Font
  • Shadow
  • Glow
  • Bevel
  • Blur
  • _alpha
Back to top Back to Top

 <chart> element Attributes

Functional Attributes

These attributes let you control a variety of functional elements on the chart. For example, you can opt to show/hide data labels, data values, y-axis values. You can also set chart limits and extended properties.

Attribute Name Type Description
animation Boolean (0/1) This attribute lets you set the configuration whether the chart should appear in an animated fashion. If you do not want to animate any part of the chart, set this as 0.
defaultAnimation Boolean (0/1) By default, each chart animates some of its elements. If you wish to switch off the default animation patterns, you can set this attribute to 0. It can be particularly useful when you want to define your own animation patterns using the Styles feature.
clickURL URL in FusionCharts format The entire chart can now act as a hotspot. Use this URL to define the hotspot link for the chart. The link can be specified in FusionCharts link format.
palette Number (1-5) Each chart has 5 pre-defined color palettes which you can choose from. Each palette renders the chart in a different color theme. Valid values are 1-5.
paletteThemeColor Color Code If you want your own palette derived from a particular hex color, you can specify the same here. All other colors on the chart will automatically derive from that palette.
paletteColors String
(List of hex color codes separated by comma)
The palette attribute allows to select a palette theme that applies to chart background, canvas, font and tool-tips, it does not change the colors of dataplots (i.e., column, line, area etc.). The paletteThemeColor attribute allows to specify your own palette derived from a particular hex color that is applied to chart background, canvas, font, tool-tips and also dataplots.

Using paletteColors attribute, you can specify your custom list of hex colors for the dataplots only. The list of colors have to be separated by comma e.g., <chart paletteColors='FF0000,0372AB,FF5904...'>. The chart will cycle through the list of specified colors and then render the data plot accordingly.

To use the same set of colors throughout all your charts in a web application, you can store the list of palette colors in your application globally and then provide the same in each chart XML.

showRTMenuItem Boolean (0/1) Whether to show the real-time update related menu items (like Start/Stop Update or Clear Chart) in chart's context menu?

Note: For JavaScript charts real-time update related menu items do not appear by default. You need to explicitly set showRTMenuItem='1' in <chart> element. The menu appears as a button on the bottom-left corner of the JavaScript chart. You can then use the button to Start/Stop Update or Clear chart.

showPrintMenuItem Boolean (0/1) Whether to show "Print Chart" item in the context menu of the chart? Even if you opt to hide the item in context menu, you can still opt to invoke print() JavaScript method of the chart to print the same.
showAboutMenuItem Boolean (0/1) Setting this to 1 displays a custom context menu in the chart; this can be customized to show your text and can be linked to your URL. For e.g., you can set the context menu of the chart to include "About your company name" and then link to your company home page. By default, the chart shows "About FusionCharts" when right clicked.
aboutMenuItemLabel String The menu item label for the custom context menu item.
aboutMenuItemLink String Link for the custom context menu item. You can specify the link in FusionCharts link format to be able to open the same in new window, pop-ups, frames or as JavaScript links.
useRoundEdges
Since v 3.2
Boolean (0/1) If you wish to plot columns with round edges and fill them with a glass effect gradient, set this attribute to 1.

The following functionalities will not work when this attribute is set to 1:

  • showShadow attribute doesn't work anymore. If you want to remove shadow from columns, you'll have to over-ride the shadow with a new shadow style (applied to DATAPLOT) with alpha as 0.
  • Plot fill properties like gradient color, angle etc. will not work anymore, as the colors for gradient are now calculated by the chart itself.
  • Plot border properties also do not work in this mode. Also, you cannot render the border as dash in this mode.
refreshInstantly
Since v 3.2
Boolean (0/1) By default, the real-time charts wait for a few seconds after rendering for the first time and before updating itself with new data. To allow the chart to start updating itself as soon as it is rendered, set this attribute to 1.
manageResize
Since v 3.2
Boolean (0/1) Setting this attribute to 1, you can allow the chart to automatically resize itself when the parent container of the chart is resized.
useEllipsesWhenOverflow
Since v 3.2
Boolean (0/1) When enabled in AUTO mode, long data labels are truncated by adding ellipses to prevent them from overflowing the chart background. The default value is 1.
Back to top Back to Top

Chart Titles and Axis Names

Using these attributes, you can set the various headings and titles of chart like caption, sub-caption, x-axis and y-axis names etc.

Attribute Name Type Description
caption String Caption of the chart.
subCaption String Sub-caption of the chart.
xAxisName String X-Axis Title of the Chart.
yAxisName String Y-Axis Title of the chart.
rotateYAxisName Boolean (0/1) If you do not wish to rotate y-axis name, set this as 0. It specifically comes to use when you've special characters (UTF8) in your y-axis name that do not show up in rotated mode.
yAxisNameWidth Number (Pixels) If you opt to not rotate y-axis name, you can choose a maximum width that will be applied to y-axis name.
Back to top Back to Top

Chart Y-Axis

Using these attributes, you can set the various properties of the Y-Axis.

Attribute Name Type Description
setAdaptiveYMin Boolean (0/1) This attribute lets you set whether the y-axis lower limit will be 0 (in case of all positive values on chart) or should the y-axis lower limit adapt itself to a different figure based on values provided to the chart.
yAxisMinValue Number This attribute helps you explicitly set the lower limit of the chart. If you don't specify this value, it is automatically calculated by FusionCharts based on the data provided by you.
yAxisMaxValue Number This attribute helps you explicitly set the upper limit of the chart. If you don't specify this value, it is automatically calculated by FusionCharts based on the data provided by you.
showYAxisValues Boolean (0/1) The y-axis of charts is divided into vertical sections using div (divisional) lines. Each div line assumes a value based on its position. Using this attribute you can set whether to show those div line (y-axis) values or not. The values of showLimits and showDivLineValues if specified explicitly overrides the value of this attribute.
showLimits Boolean (0/1) Whether to show chart limit values. If not specified showYAxisValues attribute overrides this value.
showDivLineValues Boolean (0/1) Whether to show div line values. If not specified showYAxisValues attribute overrides this value.
yAxisValuesStep Number By default, all div lines show their values. However, you can opt to display every x(th) div line value using this attribute.
yAxisValueDecimals Number Decimal places for y-axis values.
forceYAxisDecimals Boolean (0/1) Whether to force decimal places for y-axis values.
Back to top Back to Top

Chart Labels & Values

Data labels refer to the names for the data points which appear on the x-axis and data values refer to the plot values i.e., values of each data plot.

Attribute Name Type Description
showLabels Boolean (0/1) It sets the configuration whether the x-axis labels will be displayed or not.
labelDisplay WRAP, STAGGER, ROTATE or NONE Using this attribute, you can control how your data labels (x-axis labels) will appear on the chart. There are 4 options: WRAP, STAGGER, ROTATE or NONE. WRAP wraps the label text if it's longer than the allotted area. ROTATE rotates the label in vertical or slanted position. STAGGER divides the labels into multiple lines.
slantLabels Boolean (0/1) If you've opted to show rotated labels on chart, this attribute lets you set the configuration whether the labels will show as slanted labels or fully vertical ones.
labelStep Number By default, all the labels are displayed on the chart. However, if you've a set of streaming data (like name of months or days of week), you can opt to show every n-th label for better clarity. This attributes just lets you do so. It allows you to display every n(th) X-axis label.
staggerLines Number If you've opted for STAGGER mode as labelDisplay, using this attribute you can control how many lines to stagger the label to. By default, all labels are displayed in a single line.
showValues Boolean (0/1) Sets the configuration whether data values will be displayed along with the data plot on chart.
placeValuesInside Boolean (0/1) If you've opted to show data values, you can show them inside the columns using this attribute. By default, the data values show outside the column.
rotateValues Boolean (0/1) If you've opted to show data values, you can rotate them using this attribute.
Back to top Back to Top

Real-time properties

Using these attributes, you can configure the data streaming feature.

Attribute Name Type Description
dataStreamURL URL This parameter sets the path of the page which is supposed to relay real-time data to the chart. If you've special characters as a part of your data stream URL, like ? or &, you'll need to URL Encode the entire dataStreamURL

This page needs to be on the same sub-domain on which the chart is hosted and invoked from. Otherwise, the Flash sandbox security will restrict it from accessing the data and hence the real-time feature won't work.
Example: dataStreamURL='liveQuote.aspx?name=xyz'
refreshInterval Number For this parameter, you can specify the number of seconds after which the chart will look for new data. This process will happen continuously - i.e., if you specify 5 seconds here, the chart will look for new data every 5 seconds.
clearChartInterval Number The time after which the chart will keep clearing its contents.
updateInterval Number If you want the chart to keep polling for new data every x seconds and queue it, you can specify that x seconds as updateInterval. This helps you poll at different intervals and then draw at another interval (specified as refreshInterval).
numDisplaySets Number This value helps you specify the number of data items that you want as history on the chart. For example, when you set it as 50, only 50 data items (per dataset) will be displayed on the chart. As soon as the 51st data comes in, the first data will be deleted and the rest of the data will be shifted by 1 position left - the new data will come and take the last position.
dataStamp String Constantly changing data stamp that can be added to real time Data URL, so as to maintain a state. Please see the section Real time capabilities > Adding data stamp
showRealTimeValue Boolean (0/1) This parameter lets you set whether you want the latest value (received from server) to be displayed on the chart or not.
realTimeValueSep String If you are showing real time values for multiple datasets on the chart, this attribute lets you define the separator character to separate each value's display.
Back to top Back to Top

Number Formatting Properties

Using the attributes below, you can control a myriad of options like:

  • Formatting of commas and decimals
  • Number prefixes and suffixes
  • Decimal places to which the numbers will round to
  • Scaling of numbers based on a user defined scale
  • Custom number input formats

Attribute Name Type Description
formatNumber Boolean (0/1) This configuration determines whether the numbers displayed on the chart will be formatted using commas, e.g., 40,000 if formatNumber='1' and 40000 if formatNumber='0'.
numberPrefix String Using this attribute, you could add prefix to all the numbers visible on the graph. For example, to represent all dollars figure on the chart, you could specify this attribute to ' $' to show like $40000, $50000. For more details, please see Advanced Charting > Number Formatting section.
numberSuffix String Using this attribute, you could add suffix to all the numbers visible on the graph. For example, to represent all figure quantified as per annum on the chart, you could specify this attribute to ' /a' to show like 40000/a, 50000/a. For more details, please see Advanced Charting > Number Formatting section.
decimals Number Number of decimal places to which all numbers on the chart will be rounded to. For more details, please see Advanced Charting > Number Formatting section.
forceDecimals Boolean (0/1) Whether to add 0 padding at the end of decimal numbers? For example, if you set decimals as 2 and a number is 23.4. If forceDecimals is set to 1, the number will automatically be converted to 23.40 (note the extra 0 at the end). For more details, please see Advanced Charting > Number Formatting section.
formatNumberScale Boolean (0/1) Configuration whether to add K (thousands) and M (millions) to a number after truncating and rounding it - e.g., if formatNumberScale is set to 1, 1043 will become 1.04K (with decimals set to 2 places). Same with numbers in millions - an M will be added at the end. For more details, please see Advanced Charting > Number Formatting section.
defaultNumberScale String The default unit of the numbers that you're providing to the chart. For more details, please see Advanced Charting > Number Formatting section.
numberScaleUnit String Unit of each block of the scale. For more details, please see Advanced Charting > Number Formatting section.
numberScaleValue String Range of the various blocks that constitute the scale. For more details, please see Advanced Charting > Number Formatting section.
scaleRecursively Boolean (0/1) Whether to scale the number recursively? For more details, please see Advanced Charting > Number Formatting section.
maxScaleRecursion Number How many recursions to complete during recursive scaling? -1 completes the entire set of recursion. For more details, please see Advanced Charting > Number Formatting section.
scaleSeparator String What character to use to separate the scales that generated after recursion?
decimalSeparator String This option helps you specify the character to be used as the decimal separator in a number. For more details, please see Advanced Charting > Number Formatting section.
thousandSeparator String This option helps you specify the character to be used as the thousands separator in a number. For more details, please see Advanced Charting > Number Formatting section.
thousandSeparatorPosition
Since v3.2 - SR1
Number This option helps you specify the position of the thousand separator. For more details, please see Advanced Charting > Number Formatting > Basics page.
inDecimalSeparator String In some countries, commas are used as decimal separators and dots as thousand separators. In XML, if you specify such values, it will give an error while converting to number. So, the chart accepts the input decimal and thousand separators from user, so that it can convert it accordingly into the required format. This attribute lets you input the decimal separators. For more details, please see Advanced Charting > Number Formatting section.
inThousandSeparator String In some countries, commas are used as decimal separators and dots as thousand separators. In XML, if you specify such values, it will give an error while converting to number. So, the chart accepts the input decimal and thousand separatorsfrom user, so that it can convert it accordingly into the required format. This attribute lets you input the thousand separators. For more details, please see Advanced Charting > Number Formatting section.
Back to top Back to Top

Message Logger

FusionWidgets XT uses the concept of streaming and showing real-time messages in the chart using Message Logger. The Message logger can be effectively used to show necessary real-time information or live error logs.

Attribute Name Type Description
useMessageLog Boolean (0/1) Whether to use message logger for the chart?
messageLogWPercent Number (percent) This attribute lets you set the width percent of the message logger window w.r.t entire chart width. So, if you set it as 80, the message logger window will take up 80% of chart width.
messageLogHPercent Number (percent) This attribute lets you set the height percent of the message logger window w.r.t entire chart height.
messageLogShowTitle Boolean (0/1) Whether to show the title for message logger?
messageLogTitle String If you've opted to show the title for message logger, you can define your custom title here. Examples are "Error log", "Server History" etc. The title displays at the top left corner of chart.
messageLogColor Color Code You can customize the color of the entire message log window by setting a hex value for this attribute.
messageGoesToLog Boolean (0/1) The messages streamed to the chart can either be displayed in the message log window or can be passed to JavaScript. This attribute lets you control whether the messages should be logged in the in-built log window.
messageGoesToJS Boolean (0/1) This attribute lets you configure whether each message streamed from the server should be passed to a local JavaScript function.
messageJSHandler String If you've opted to pass each message to JavaScript function, this attribute lets you define the name of the function. This helps you create your custom functions to react to messages streamed from server.
messagePassAllToJS Boolean (0/1) Whether to pass all message envelope parameters to the custom JavaScript function.
Back to top Back to Top

Plot (Column) properties

These attributes let you configure how your plot (column) will appear on the chart.

Various other controls over plot cosmetics can be attained using this set of attributes.

Attribute Name Type Description
showShadow Boolean (0/1) Whether to show shadows for data plot?
showPlotBorder Boolean (0/1) Whether the column border will show up.
plotBorderColor Color Code Color for border.
plotBorderThickness Number (pixels) Border thickness.
plotBorderAlpha Number (0-100) Border alpha.
plotBorderDashed Boolean (0/1) Whether border will appear as dashed?
plotBorderDashLen Number (pixels) If dashed, then what will be length of dash?
plotBorderDashGap Number (pixels) Gap length between two dashes.
plotFillAngle Number (0-360) If you've opted to fill the plot as gradient, this attribute lets you set the fill angle for gradient.
plotFillRatio Numbers separated by comma If you've opted to fill the plot as gradient, this attribute lets you set the fill ratio for gradient.
plotFillAlpha Number (0-100) If you've opted to fill the plot as gradient, this attribute lets you set the fill alpha for gradient.
plotGradientColor Color Code You can globally add a gradient color to the entire plot of chart by specifying the second color as this attribute. For example, if you've specified individual colors for your plot and now you want a gradient that ends in white. So, specify FFFFFF (white) as this color and the chart will now draw plots as gradient.
Back to top Back to Top

Chart Cosmetics

The following attributes let you configure chart cosmetics like background color, background alpha, canvas color & alpha etc.

Attribute Name Type Description
bgColor Color Code This attribute sets the background color for the chart. You can set any hex color code as the value of this attribute. To specify a gradient as background color, separate the hex color codes of each color in the gradient using comma. Example: FF5904, FFFFFF. Remember to remove # and any spaces in between. Please see Advanced Charting > Using Gradients page for more details.
bgAlpha Number (0-100) Sets the alpha (transparency) for the background. If you've opted for gradient background, you need to set a list of alpha(s) separated by comma. Please see Advanced Charting > Using Gradients page for more details.
bgRatio Numbers separated by comma If you've opted for a gradient background, this attribute lets you set the ratio of each color constituent. Please see Advanced Charting > Using Gradients page for more details.
bgAngle Number (0-360) Angle of the background color, in case of a gradient. Please see Advanced Charting > Using Gradients page for more details.
showBorder Boolean (0/1) Whether to show a border around the chart or not?
borderColor Color Code Border color of the chart.
borderThickness Number (Pixels) Border thickness of the chart.
borderAlpha Number (0-100) Border alpha of the chart.
bgImage

or

bgSWF - deprecated
String To place any image (JPG/PNG/GIF) or Flash movie (SWF) as background of the chart, enter the (path and) name of the background image or SWF file. It should be in the same domain as the chart.

Loading of Flash movie is deprecated and is not supported by JavaScript charts.

bgImageAlpha

or

bgSWFAlpha - deprecated
Number (0-100) Helps you specify the opacity for the loaded background image or Flash movie.

Loading of Flash movie is deprecated and is not supported by JavaScript charts.

bgImageDisplayMode
Since v3.2
String (stretch, tile, fit, fill, center, none) Helps you specify the mode in which the background image is to be displayed.
  • Stretch - expands the image to fit the entire chart area, without maintaining original image constraints
  • Tile - the image is repeated as a pattern on the entire chart area
  • Fit - fits the image proportionately on the chart area
  • Fill -proportionately fills the entire chart area with the image
  • Center - the image is positioned at the center of the chart area
  • None - Default mode. None of the above modes are applied
For more details click here.
bgImageVAlign
Since v3.2
String (top, middle, bottom) Helps you to vertically align the background image.
bgImageHAlign
Since v3.2
String (left, middle, right) Helps you to horizontally align the background image.
bgImageScale
Since v3.2
Number (0-300) Helps you magnify the background image. This attribute will only work when the attribute bgImageDisplayMode is set to none, center or tile.
logoURL String You can load an external logo (JPEG/PNG/SWF) on the chart once it has rendered. This attribute lets you specify the URL of the same. Owing to Flash Player security settings, you can only specify logos that are on the sub-domain as the SWF file of the chart.
logoPosition String ( TL, TR, BL, BR, CC )

Where to position the logo on the chart:

  • TL - Top-left
  • TR - Top-right
  • BR - Bottom right
  • BL - Bottom left
  • CC - Center of screen
logoAlpha Number (0-100) Once the logo has loaded on the chart, you can configure its opacity using this attribute.
logoScale Number (0-100) You can also change the size of externally loaded logo at run-time by specifying a value for this parameter.
logoLink String If you want to link the logo to an external URL, specify the link in this attribute. The link can be in FusionCharts link format, allowing you to link to new windows, pop-ups, frames etc.
Back to top Back to Top

Canvas Cosmetics

Canvas refers to the area in which the chart is plotted. The following attributes can be used to customize the canvas:

Attribute Name Type Description
canvasBgColor Color Code Sets Canvas background color. For Gradient effect, enter colors separated by comma.
canvasBgAlpha Number (0-100) Sets alpha for Canvas Background. For gradient, enter alpha list separated by commas.
canvasBgRatio Numbers separated by comma Helps you specify canvas background ratio for gradients.
canvasBgAngle Number (0-360) Helps you specify canvas background angle in case of gradient.
canvasBorderColor Color Code Lets you specify canvas border color.
canvasBorderThickness Number (Pixels) Lets you specify canvas border thickness.
canvasBorderAlpha Number (0-100) Lets you control transparency of canvas border.
Back to top Back to Top

Divisional Lines/Grids

Using this set of attributes, you can control the properties of divisional lines and alternate color bands.

Divisional Lines are horizontal or vertical lines running through the canvas. Each divisional line signifies a smaller unit of the entire axis thus aiding the users in interpreting the chart.

Alternate color bands are colored blocks between two successive divisional lines.

Attribute Name Type Description
numDivLines Number Number of horizontal axis division lines that you want on the chart.
divLineColor Color Code Color for divisional lines.
divLineThickness Number (Pixels) Thickness of divisional lines.
divLineAlpha Number (0-100) Alpha of divisional lines.
divLineIsDashed Boolean (0/1) Whether the divisional lines should display as dash?
divLineDashLen Number (Pixels) If the divisional lines are to be displayed as dash, this attribute lets you control the length of each dash.
divLineDashGap Number (Pixels) If the divisional lines are to be displayed as dash, this attribute lets you control the length of each gap between dashes.
showAlternateHGridColor Boolean (0/1) Whether to show alternate colored horizontal grid bands?
alternateHGridColor Color Code Color of the alternate horizontal grid bands.
alternateHGridAlpha Number (0-100) Alpha (transparency) of the alternate horizontal grid bands.
Back to top Back to Top

Zero Plane properties

The zero plane is a 2D/3D plane that signifies the 0 position on the chart which separates the positive and negative numbers on a chart having both of them. If there are no negative numbers on the chart, you won't see a visible zero plane. You can customize the zero plane with the following properties:

Attribute Name Type Description
zeroPlaneColor Color Code Color for the Zero Plane. Zero Plane is the line/plane that appears at 0 y-position on canvas, when negative data is being shown on the chart.
zeroPlaneThickness Number (Pixels) Thickness of zero plane.
zeroPlaneAlpha Number (0-100) Alpha of zero plane.
showZeroPlaneValue
Since v 3.2
Boolean (0/1) To display the value of the zero plane, set this attribute to 1.
Back to top Back to Top

Font Properties

Using the attributes below, you can define the generic font properties for all the text on the chart. These attributes allow you a high level control over font properties.

If you intend to specify font properties for individual chart elements (like Caption, sub-caption etc.), you'll need to use the Styles feature. Using Styles, you can also specify advanced font properties like Bold, Italics, HTML Mode etc. Using Styles you can also configure real-time values.

Attribute Name Type Description
baseFont Font Name This attribute lets you set the font face (family) of all the text (data labels, values etc.) on chart. If you specify outCnvBaseFont attribute also, then this attribute controls only the font face of text within the chart canvas bounds.
baseFontSize Number This attribute sets the base font size of the chart i.e., all the values and the names in the chart which lie on the canvas will be displayed using the font size provided here.
baseFontColor Color Code This attribute sets the base font color of the chart i.e., all the values and the names in the chart which lie on the canvas will be displayed using the font color provided here.
outCnvBaseFont Font Name This attribute sets the base font family of the chart font which lies outside the canvas i.e., all the values and the names in the chart which lie outside the canvas will be displayed using the font name provided here.
outCnvBaseFontSize Number This attribute sets the base font size of the chart i.e., all the values and the names in the chart which lie outside the canvas will be displayed using the font size provided here.
outCnvBaseFontColor Color Code This attribute sets the base font color of the chart i.e., all the values and the names in the chart which lie outside the canvas will be displayed using the font color provided here.
realTimeValueFont Font Name If real time value is to be displayed on the chart, this attribute lets you set the font face of the same.
realTimeValueFontSize Number If real time value is to be displayed on the chart, this attribute lets you set the font size of the same.
realTimeValueFontColor Color Code If real time value is to be displayed on the chart, this attribute lets you set the font color of the same.
Back to top Back to Top

Legend Properties

In multi-series charts, the series name of each dataset shows up in the legend of the chart. If you do not need the legend, you can opt to hide the same.

Also, the legend can be placed at the bottom of the chart or to the right of the chart.

Using the attributes below, you can configure the functional and cosmetic properties of the legend.

Attribute Name Type Description
showLegend Boolean (0/1) Whether to show legend for the chart (only multi-series and combination charts)?
legendPosition RIGHT or BOTTOM The legend can be plotted at two positions on the chart - below the chart (BOTTOM) and on the RIGHT side of the chart.
interactiveLegend Boolean (0/1) This attribute lets you interact with the legend in your chart. When you click a legend key, the dataplots associated with that series are eliminated from the chart. Re-clicking the key causes the dataplots to reappear.
legendCaption String You can add a caption for the entire legend by setting the same here.
legendMarkerCircle
deprecated. Not applicable.
Boolean (0/1) Whether to use square legend keys or circular ones?
legendBorderColor Color Code Border Color for the legend.
legendBorderThickness Number (Pixels) Border thickness for the legend.
legendBorderAlpha Number (0-100) Border alpha for the legend.
legendBgColor Color Code Background color for the legend.
legendBgAlpha Number (0-100) Background alpha for the legend.
legendShadow Boolean (0/1) Whether to show a shadow for legend?
legendAllowDrag Boolean (0/1) The legend can be made drag-able by setting this attribute to 1. End viewers of the chart can drag the legend around on the chart.
legendScrollBgColor Color Code If you've too many items on the legend, a scroll bar shows up on the same. This attribute lets you configure the background color of the scroll bar.
legendScrollBarColor Color Code If you've too many items on the legend, a scroll bar shows up on the same. This attribute lets you configure the bar color of the scroll bar.
legendScrollBtnColor Color Code If you've too many items on the legend, a scroll bar shows up on the same. This attribute lets you configure the color of buttons of the scroll bar.
reverseLegend Boolean (0/1) You can reverse the ordering of datasets in the legend by setting this attribute to 1.
legendIconScale
Since v 3.2
Number (0-5) Scaling of legend icon is possible starting FusionWidgets XT. This attribute lets you control the size of legend icon.
legendNumColumns
Since v 3.2
Number (positive integer) If your chart contains multiple series, the legend is displayed as a grid comprising of multiple legend keys. With the help of this attribute you can specify the number of columns that are to be displayed in the legend.
minimiseWrappingInLegend
Since v 3.2
Boolean (0/1) Whether to minimize legend item text wrapping.
Back to top Back to Top

Tooltip properties

These attributes let you control the tooltip. You can set the background color, border color, separator character and few other details.

Attribute Name Type Description
showToolTip Boolean (0/1) Whether to show tooltip on chart?
seriesNameInToolTip Boolean (0/1) This attribute lets you control whether series name will show up in tooltip or not.
toolTipBgColor Color Code Background Color for tooltip.
toolTipBorderColor Color Code Border Color for tooltip.
toolTipSepChar String The character specified as the value of this attribute separates the name and value displayed in tooltip.
showToolTipShadow Boolean (0/1) Whether to show shadow for tooltips.
Back to top Back to Top

Chart Paddings & Margins

The following attributes help you control chart margins and paddings.

FusionWidgets XT allows you manually customize the padding of various elements on the chart to allow advanced manipulation and control over chart visualization. Padding in FusionWidgets XT is always defined in pixels, unless the attribute itself suggests some other scale (like plotSpacePercent).

You can also define the chart margins. Chart Margins refer to the empty space left on the top, bottom, left and right of the chart.

It's not necessary for you to specify any padding/margin values. FusionWidgets XT automatically assumes the best values for the same, if you do not specify the same.

Attribute Name Type Description
captionPadding Number (Pixels) This attribute lets you control the space (in pixels) between the sub-caption and top of the chart canvas. If the sub-caption is not defined, it controls the space between caption and top of chart canvas. If neither caption, nor sub-caption is defined, this padding does not come into play.
xAxisNamePadding Number (Pixels) Using this, you can set the distance between the top end of x-axis title and the bottom end of data labels (or canvas, if data labels are not to be shown).
yAxisNamePadding Number (Pixels) Using this, you can set the distance between the right end of y-axis title and the start of y-axis values (or canvas, if the y-axis values are not to be shown).
yAxisValuesPadding Number (Pixels) This attribute helps you set the horizontal space between the canvas left edge and the y-axis values or trend line values (on left/right side). This is particularly useful, when you want more space between your canvas and y-axis values.
labelPadding Number (Pixels) This attribute sets the vertical space between the labels and canvas bottom edge. If you want more space between the canvas and the x-axis labels, you can use this attribute to control it.
valuePadding Number (Pixels) It sets the vertical space between the end of columns and start of value textboxes. This basically helps you control the space you want between your columns/anchors and the value textboxes.
plotSpacePercent Number (Percent) 20-80 On a column chart, there is spacing defined between two columns. By default, the spacing is set to 20% of canvas width. If you intend to increase or decrease the spacing between columns, you can do so using this attribute. For example, if you wanted all columns to stick to each other without any space in between, you can set plotSpacePercent to 0. Similarly, if you want very thin columns, you can set plotSpacePercent to its max value of 80.
realTimeValuePadding Number (Pixels) Vertical distance between the real-time value and x-axis labels.
legendPadding Number (Pixels) Padding of legend from right/bottom side of canvas.
chartLeftMargin Number (Pixels) Amount of empty space that you want to put on the left side of your chart. Nothing is rendered in this space.
chartRightMargin Number (Pixels) Amount of empty space that you want to put on the right side of your chart. Nothing is rendered in this space.
chartTopMargin Number (Pixels) Amount of empty space that you want to put on the top of your chart. Nothing is rendered in this space.
chartBottomMargin Number (Pixels) Amount of empty space that you want to put on the bottom of your chart. Nothing is rendered in this space.
canvasLeftMargin Number (Pixels) Left margin of canvas. Canvas will start from that position.
canvasRightMargin Number (Pixels) Right margin of canvas. Canvas will end at that position.
canvasTopMargin Number (Pixels) Top margin of canvas.
canvasBottomMargin Number (Pixels) Bottom margin of canvas.
Back to top Back to Top

<categories> element

The <categories> element lets you bunch together x-axis labels of the chart. For a multi-series chart, it's necessary to provide data labels using <category> elements under <categories> element.

The following properties of <categories> element help you control the font properties of data labels.

Attribute Name Type Description
font String Lets you specify font face for the x-axis data labels.
fontSize Number Lets you specify font size for the x-axis data labels.
fontColor Color Code Lets you specify font color for the x-axis data labels.
Back to top Back to Top

<category> element

Each <category> element represents an x-axis data label.

In multi-series charts, it's necessary to provide an equal number of <category> elements and data items (<set> elements within each <dataset>).

You can specify the following attributes for <category> element:

Attribute Name Type Description
label String This attribute determines the label for the data item. The label appears on the x-axis of chart.
showLabel Boolean (0/1) You can individually opt to show/hide labels of individual data items using this attribute.
tooltext String The tooltip defined in the <category> element appears only when the mouse cursor is hovered over the data plots. However, this will not appear when the cursor is moved over the data labels (except for a situation when long labels are automatically truncated with ellipses. In this situation, if the mouse cursor is hovered over a truncated label, the tooltip will appear with the full label).

In case you want to set a short label and show the full label in tooltip, define the full label using this attribute within the <category> element. The tooltip with the full label will appear only when the mouse is hovered on the dataplot.
Back to top Back to Top

Vertical data separator lines

vLines are vertical separator lines that help you separate blocks of data. These lines run through the height of the chart, thereby segregating data into different blocks.

In multi-series charts, it is used between <category> elements as under:

Attribute Name Type Description
label String Display label for the vLine.
color Color Code This attribute defines the color of vertical separator line.
thickness Number (pixels) Thickness in pixels of the vertical separator line.
alpha Number (0-100) Alpha of the vertical separator line.
dashed Boolean (0/1) Whether the vertical separator line should appear as dashed?
dashLen Number (pixels) If the vertical separator line is to appear as dashed, this attribute defines the length of dash.
dashGap Number (pixels) If the vertical separator line is to appear as dashed, this attribute defines the length of dash gap.
Back to top Back to Top

<dataset> element

Each <dataset> element contains a series of data.

For example, if we're plotting a performance chart for 2 processors, the first dataset will contain the data for Processor A and the next one for the Processor B.

You can provide dataset level cosmetics so that all data within that dataset will be plotted in the same color/alpha/etc.

Also, each dataset can be named using the seriesName attribute of <dataset> element. The series name appears in the legend of the chart.

Attribute Name Type Description
seriesName String Lets you specify the series name for a particular dataset. For example, if you're plotting a chart to indicate monthly sales analysis for 2005 and 2006, the seriesName for the first dataset will be 2005 and that of the second will be 2006. The seriesName of a dataset is shown in legend.
color Color Code This attribute sets the color using which columns, lines, area of that dataset will be drawn. For column chart, you can specify a list of comma separated hex codes to get a gradient plot.
alpha Number (0-100) This attribute sets the alpha (transparency) of the entire dataset.
showValues Boolean (0/1) Whether to show the values for this dataset?
includeInLegend Boolean (0/1) Whether to include the seriesName of this dataset in legend? This can be particularly useful when you're using combination charts and you've used the area/line chart to plot a trend and you do not want the seriesName of that trend to appear in legend.
checkForAlerts Boolean (0/1) Whether to run the values of this dataset through alert manager, each time an update is received?
dashed Boolean (0/1) Whether this dataset border will appear as dashed?
Back to top Back to Top

<set> element

Each <set> element (child of <chart> or <dataset> element) represents a set of data which is to be plotted on the graph and determines a set of data which will appear on the chart.

For a multi-series chart, it could look like:

<dataset seriesName='2006'>
	<set value='35445' />
	<set value='35675' />
	.... and so on ....
</dataset>

In multi-series charts, you should again note that the number of <category> elements should be equal to the number of data points in each data sets, i.e., if you mention twelve categories (twelve months), the data for both years (2005 & 2006) should also contain twelve <set> elements (twelve rows of data).

Attribute Name Type Description
value Number Numerical value for the data item. This value will be plotted on the chart.
link String You can define links for individual data items. That enables the end user to click on data items (columns, lines, bars, etc.) and drill-down to other pages. To define the link for data items, use the link attribute. You can define links that open in same window, new window, pop-up window or frames. Please see Drill-Down Charts section for more information. Also, you'll need to URL Encode all the special characters (like ? and &) present in the link.
toolText String By default, FusionWidgets XT shows the "label, value" as tooltip text for that data item. But, if you want to display more information for the data item as tooltip, you can use this attribute to specify the same.
color Color Code For multi-series charts, you can define the color of datasets at dataset level. However, if you wish to highlight a particular data element, you can specify its color at "set" level using this attribute. This attribute accepts hex color codes without #.
alpha Number (0-100) For multi-series charts, you can define the alpha of datasets at dataset level. However, if you wish to highlight a particular data element, you can specify its alpha at "set" level using this attribute.
showValue Boolean (0/1) You can individually opt to show/hide values of individual data items using this attribute. This value over-rides the dataset level value.
dashed Boolean (0/1) Whether the border of this data item should appear as dashed? This is particularly useful when you want to highlight a data (such as forecast or trend etc.). This value over-rides the dataset level value.
Back to top Back to Top

<trendlines> --> <line> element

Using the <trendLines> element (and children <line> elements), you can define trend lines on the chart.

Trend lines are horizontal lines spanning the chart canvas which aid in interpretation of data with respect to some pre-determined value. For example, if you are plotting sales data of current year, you might want to add previous year's average monthly sales as trend indicator for ease of comparison.

For each trend line on the chart, you need to define a <line> element under <trendLines> element as under:

<trendLines>
  <line startValue='895' color='FF0000' displayValue='Average' />
</trendLines>

You can control the cosmetic and functional properties of trend-lines using the following attributes:

Attribute Name Type Description
startValue Number The starting value for the trendline. Say, if you want to plot a slanted trendline from value 102 to 109, the startValue will be 102.
endValue Number The ending y-axis value for the trendline. Say, if you want to plot a slanted trendline from value 102 to 109, the endValue will be 109. If you do not specify a value for endValue, it will automatically assume the same value as startValue.
displayValue String If you want to display a string caption for the trend line by its side, you can use this attribute. Example: displayValue='Last Month High'. When you don't supply this attribute, it automatically takes the value of startValue.
color Color Code Color of the trend line and its associated text.
thickness Number (Pixels) If you've opted to show the trend as a line, this attribute lets you define the thickness of trend line.
isTrendZone Boolean (0/1) Whether the trend will display a line or a zone (filled colored rectangle).
alpha Number Alpha of the trend line.
showOnTop Boolean (0/1) Whether the trend line/zone will be displayed over data plots or under them?
dashed Boolean (0/1) If you've opted to show the trend as a line, this attribute lets you define whether the trend line will appear as dashed?
dashLen Number (Pixels) If you've opted to show trend line as dash, this attribute lets you control the length of each dash.
dashGap Number (Pixels) If you've opted to show trend line as dash, this attribute lets you control the length of each dash gap.
valueOnRight Boolean (0/1) Whether to show the trend line value on left side or right side of chart? This is particularly useful when the trend line display values on the chart are colliding with divisional lines values on the chart.
Back to top Back to Top

The XML API for the following features have not been discussed here:

  • Exporting Chart: All the attributes pertinent to exporting of charts as images or PDFs are discussed in the Exporting as Image/PDF section.
  • Exporting Chart Data: All the attributes pertinent to exporting of chart data are discussed in the Exporting Chart Data section.
  • Annotations - All the attributes pertinent to annotations are discussed in the Annotations section.
  • Alert Manager - All the attributes pertinent to alerts are discussed in the Alert Manager section.
  • Styles - All the attributes pertinent to Styles are discussed in the Using Styles section.