In our previous examples, we saw how to pass single update from the data provider page for each dataset on the chart. However, in each update, you can pass any number of updates for each dataset.
To do so, you just need to output the values in following format:
&label=11:45,11:46,11:47&value=33,32,34|22,24,25
In the above data, we're providing three updates to both dataset present on the chart. Also, we're providing three new labels for the x-axis. When providing multiple values to update, the values within each dataset need to be separated by comma. And like before, each dataset should be separated by the | (pipe) character.
<%@ Language=VBScript %>
      <%
	'This page is meant to output the Stock Price of Google in real-time data format.
	'The data will be picked by FusionWidgets XT real-time line chart and plotted on chart.
	'You need to make sure that the output data doesn't contain any HTML tags or carriage returns.
	'For the sake of demo, we'll just be generating random values and returning them
	'In real life applications, you can get the data from web-service or your own data systems, convert it into real-time
	data format and then return to the chart.

	'Set randomize timers on
	Randomize()
	Randomize Timer

	Dim lowerLimitGoog, upperLimitGoog
	Dim lowerLimitDell, upperLimitDell
	Dim googlePrice1, googlePrice2, googlePrice3
	Dim dellPrice1, dellPrice2, dellPrice3
	Dim currDateTime, dateTimeLabel1, dateTimeLabel2, dateTimeLabel3

	lowerLimitGoog = 30
	upperLimitGoog = 35
	lowerLimitDell = 22
	upperLimitDell = 26

	'Generate random values - and round them to 2 decimal places
	googlePrice1 = Int(Rnd()*100*(upperLimitGoog-lowerLimitGoog))/100+lowerLimitGoog
	googlePrice2 = Int(Rnd()*100*(upperLimitGoog-lowerLimitGoog))/100+lowerLimitGoog
	googlePrice3 = Int(Rnd()*100*(upperLimitGoog-lowerLimitGoog))/100+lowerLimitGoog
	dellPrice1 = Int(Rnd()*100*(upperLimitDell-lowerLimitDell))/100+lowerLimitDell
	dellPrice2 = Int(Rnd()*100*(upperLimitDell-lowerLimitDell))/100+lowerLimitDell
	dellPrice3 = Int(Rnd()*100*(upperLimitDell-lowerLimitDell))/100+lowerLimitDell

	'Get the current date
	currDateTime = Now()

	'Get 3 labels for the data - time in format hh:mn:ss
	dateTimeLabel1 = Datepart("h",currDateTime) & ":" & Datepart("n",currDateTime ) & ":" & Datepart("s",currDateTime)
	'To change date time, we increment currDateTime by 20 seconds
	currDateTime = Dateadd("s",20, currDateTime)
	dateTimeLabel2 = Datepart("h",currDateTime) & ":" & Datepart("n",currDateTime ) & ":" & Datepart("s",currDateTime)
	currDateTime = Dateadd("s",20, currDateTime)
	dateTimeLabel3 = Datepart("h",currDateTime) & ":" & Datepart("n",currDateTime ) & ":" & Datepart("s",currDateTime

	'Now write it to output stream
	Response.Write("&label="& dateTimeLabel1 & "," & dateTimeLabel2 & "," & dateTimeLabel3 & "&value=" & googlePrice1 & "," & googlePrice2 & "," &googlePrice3 & "|" & dellPrice1 & "," & dellPrice2 & "," & dellPrice3)
    %>
This page outputs the data in following format:
&label=20:59:24,20:59:44,21:0:4&value=34.23,30.46,34.74|22.15,23.91,25.92
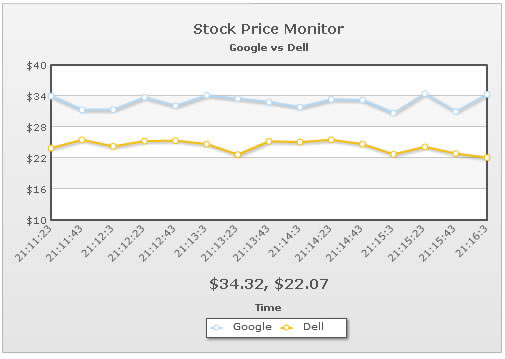
As you can see, we're adding three labels and three values to each dataset. When you run the chart, you'll see 3 values being added to each dataset in each update, as shown below: