The data streaming charts allow you to feed data to the chart using JavaScript too, instead of real-time data provider page. The format of data feed, however, should be the same as that outputted by the real-time data provider page.
You can use the feedData(strData) method to feed data to the chart. Here, strData is a string value which should contain the data in exactly the same format as that provided by the real-time data provider page.
Shown below is an example:
<html>
<head>
	<script type="text/javascript" src="../Charts/FusionCharts.js"></script>
	<script language="javascript">
		//This method is called when user clicks on the feed data button
		function feedDataToChart(){
			//Get reference to the chart using its ID
			var chartRef = FusionCharts("ChId1");
			//We need to create a querystring format incremental update, containing
			//label in hh:mm:ss format
			//and a value (random).
			var currDate = new Date();
			var label= currDate.getHours() + ":" + currDate.getMinutes() + ":" + currDate.getSeconds();
			//Get random number between 30 & 35 - rounded to 2 decimal places
			var randomValue = Math.floor(Math.random()*500)/100 + 30;
			//Build Data String in format &label=...&value=...
			var strData = "&label=" + label + "&value=" + randomValue;
			//Feed it to chart.
			chartRef.feedData(strData);
			return;
		}
	</script>
</head>
<body>
<center>
	<div id="chart1div">
	This text is replaced by the Flash movie.
	</div>
	<script type="text/javascript">
		var chart1 = new FusionCharts("../Charts/RealTimeLine.swf", "ChId1", "500", "350", "0", "1");
		chart1.setXMLUrl("Data.xml");
		chart1.render("chart1div");
	</script>
	<input type='button' value='Feed Random Data' onClick='javascript:feedDataToChart();' >
</center>
</body>
</html>
In the above code, we're doing the following:
- Instantiate our chart without any data and one single dataset.
- Define a custom function feedDataToChart() which gets invoked when the user clicks the Feed Random Data button.
This function builds the data (in real-time data format) to be specified to the chart. It contains random value for demo purpose. - We finally feed the data to chart using feedData(strData) method.
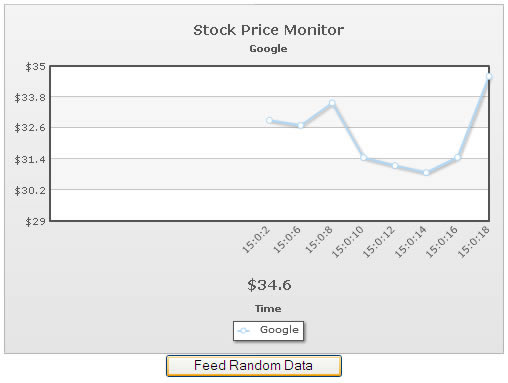
When you now view this example, you'll get something as under (image taken after button was clicked a few times):