Let us take a look at the Rectangle Annotation here. It is one of the simplest annotations you can have on the chart. A rectangle annotation will look as under: |
 |
| |
| The XML/JSON to create the above rectangle is: |
| |
<chart>
     ...
     <annotations>
        <annotationGroup id="Grp1">
           <annotation type="rectangle" color="639ACE" x="200" y="200" toX="300" toY="300"/>
        </annotationGroup>
     </annotations>
     ...
</chart>
{
  "chart": {},
  ...
  "annotations": {
    "groups": [
      {
        "id": "Grp1",
        "items": [
          {
            "type": "rectangle",
            "color": "639ACE",
            "x": "200",
            "y": "200",
            "tox": "300",
            "toy": "300"
          }
        ]
      }
    ]
  }
 ...
}
|
| |
| As it is very clear from the code above, we need to set the annotation type to rectangle, specify the starting x and y co-ordinates and the ending x and y co-ordinates and also a color for the rectangle. |
| |
| |
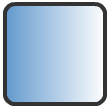
| Now suppose we want the rectangle to have a gradient background. |
| |
 |
| |
| All we need to do is to change the code to the following. |
| |
<chart>
         ...
         <annotations>
            <annotationGroup id='Grp1' >
               <annotation type='rectangle' color='639ACE,FFFFFF' x='200' y='200' toX='300' toY='300'/>
            </annotationGroup>
         </annotations>
         ...
</chart>
{
  "chart": {},
  ...
  "annotations": {
    "groups": [
      {
        "id": "Grp1",
        "items": [
          {
            "type": "rectangle",
            "color": "639ACE,FFFFFF",
            "x": "200",
            "y": "200",
            "tox": "300",
            "toy": "300"
          }
        ]
      }
    ]
    ...
  }
}
|
| |
| Thus, we have added FFFFFF to the color list to make a gradient. You can add as many colors as you want to this gradient color list. Let us add another color to the gradient - let's make the color attribute as color='639ACE,FFFFFF,FF5904': |
| |
 |
| |
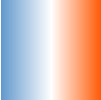
| Now let's change the gradient angle. The same can be done using fillAngle attribute. fillAngle='90' gives: |
| |
 |
| |
| We can also set the ratio in which the constituent colors of the gradient will be divided using fillRatio attribute. Since we have 3 colors in the gradient here, we need 3 values in fillRatio, which should sum up to 100. Setting fillRatio='20,10,70' will give: |
| |
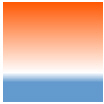 |
| |
| If you need to set the alpha (transparency) of the constituent colors of the gradient, then you have to use the fillAlpha attribute. Again this attribute should have as many values as there are colors in the gradient. For this gradient having 3 colors, one of the various combinations could be fillAlpha='50, 100, 50': |
| |
 |
| |
| |
| Let's return to our simple gradient fill with 2 colors. Now suppose we want to add a border to this rectangle. |
| |
 |
| |
| All we need to do is add showBorder='1' to the <annotation> element. Now let's make the rectangle round-edged. |
| |
 |
| |
| To achieve the above, we need to add radius='10' to the <annotation> element. The border color and thickness can be customized using the borderColor and borderThickness attributes. Setting borderColor='333333' and borderThickness='4' will give: |
| |
 |
| |
| Thus our final XML/JSON will look as under: |
| |
<chart>
         ...
         <annotations>
            <annotationGroup id='Grp1' >
               <annotation type='rectangle' color='639ACE,FFFFFF' x='200' y='200' toX='300' toY='300' showBorder='1'
                radius='10' borderColor='333333' borderThickness='4'/>
            </annotationGroup>
         </annotations>
         ...
</chart>
{
  "chart": {},
  ...
  "annotations": {
    "groups": [
      {
        "id": "Grp1",
        "items": [
          {
            "type": "rectangle",
            "color": "639ACE,FFFFFF",
            "x": "200",
            "y": "200",
            "tox": "300",
            "toy": "300",
            "showborder": "1",
            "radius": "10",
            "bordercolor": "333333",
            "borderthickness": "4"
          }
        ]
      }
    ]
    ...
  }
}
|
| |
| Thus, using the various attributes for the rectangle annotation type, you can customize it as per your requirements. |
| |
| type |
Rectangle, Circle, Polygon, Line, Arc, Text, Image |
Needs to be set to Rectangle to create a rectangle annotation type. |
| x |
Number |
The starting x co-ordinate for the annotation. This x co-ordinate is relative to the x co-ordinate of the annotation group in which the annotation is placed. For example, if you have set the x co-ordinate of the annotation group as 50 and the x co-ordinate of the annotation is 100, then the effective x co-ordinate of the annotation will be 150, w.r.t to the starting position of the chart. |
| y |
Number |
The starting y co-ordinate for the annotation. This again is relative to the starting y co-ordinate of the annotation group in which the annotation is placed. |
| toX |
Number |
The ending x co-ordinate for the rectangle. This co-ordinate is relative to the starting x-position of the annotation group in which the annotation is placed. |
| toY |
Number |
The ending y co-ordinate for the rectangle. This co-ordinate is relative to the starting y-position of the annotation group in which the annotation is placed. |
| radius |
Number |
The radius for the rounded cornered rectangle. Set a value greater than 0 to make the corner of the rectangle rounded. |
| color |
Hex Color (without the '#') |
A generic color for the annotation from which fill color and border color (whichever applies) will be derived automatically. |
| alpha |
Number(1-100) |
The alpha(transparency) of the annotation. By default, it will be set to 100. |
| |
| fillColor |
Hex code (separated by commas if there are multiple codes for a gradient) |
This attribute sets the background fill color for the annotation. You can set any hex color code as the value of this attribute. To specify a gradient as background color, separate the hex color codes of each color in the gradient using comma.
Example: FF5904, FFFFFF. Remember to remove # and any spaces in between. See the gradient specification page for more details. |
| fillAlpha |
Number (0-100) |
Sets the alpha (transparency) for the background fill. If you've opted for gradient background, you need to set a list of alpha(s) separated by comma. If the number of alpha values you have specified is lesser than the number of colors in the gradient, then the remaining colors will, by default, have an alpha of 100. |
| fillRatio |
Number (0-100) |
If you've opted for a gradient background fill, this attribute lets you set the ratio of each color constituent. The ratio for the colors should be separated by commas and the same must sum up to 100. For example, if you have 2 colors in your gradient, then the fillRatio could be 80,20. There should be no spaces in between the values. |
| fillAngle |
Number (0-360) |
Angle of the background fill color, in case of a gradient. Every color in the gradient can have a fill angle (which has to be separated by commas without any spaces in between). If the number of angle values is less than the number of colors in the gradient, then a default value of 0 is taken for the remaining colors. For example, fillAngle='90, 270' for a gradient having 2 colors. |
| fillPattern |
Radial/Linear |
The pattern of the gradient. It takes a default value of linear for rectangle. |
| showBorder |
Boolean (0/1) |
Whether to show a border for the annotation. |
| borderColor |
Hex code (without the '#') |
The border color of the annotation if showBorder='1'. |
| borderThickness |
Number (Pixels) |
The border thickness of the annotation if showBorder='1'. |
| borderAlpha |
Number (0-100) |
The border alpha(transparency) of the annotation if showBorder='1'. |
|
| |
| |
 |
| |
| The XML for the above is: |
| |
<chart ... >
         ...
         <annotations>
            <annotationGroup id='Grp1' showBelow='1'>
               <annotation type='rectangle' x='0' y='0' toX='400' toY='200' radius='10' fillColor='333333, 453269'
                fillAngle='180' />
               <annotation type='rectangle' x='5' y='5' toX='395' toY='195' radius='10' color='000000' fillAlpha='0'
                showBorder='1' borderColor='FFFFFF' borderThickness='3'/>
            </annotationGroup>
         </annotations>
</chart>
{
  "chart": {...},
  ...
  "annotations": {
    "groups": [
      {
        "id": "Grp1",
        "showbelow": "1",
        "items": [
          {
            "type": "rectangle",
            "x": "0",
            "y": "0",
            "tox": "400",
            "toy": "200",
            "radius": "10",
            "fillcolor": "333333, 453269",
            "fillangle": "180"
          },
          {
            "type": "rectangle",
            "x": "5",
            "y": "5",
            "tox": "395",
            "toy": "195",
            "radius": "10",
            "color": "000000",
            "fillalpha": "0",
            "showborder": "1",
            "bordercolor": "FFFFFF",
            "borderthickness": "3"
          }
        ]
      }
    ]
  }
}
|