You are viewing documentation for an older version. For current documentation - click here.

Let us take a look at the Line Annotation here. A line annotation looks as under:

 
The XML/JSON to create the above is:
 
<chart>
         ...
         <annotations>
            <annotationGroup id='Grp1' >
               <annotation type='line' x='200' y='200' toX='300' toY='300' color='639ACE'/>
            </annotationGroup>
         </annotations>
         ...
</chart>
{
  "chart": {},
  ...
  "annotations": {
    "groups": [
      {
        "id": "Grp1",
        "items": [
          {
            "type": "line",
            "x": "200",
            "y": "200",
            "tox": "300",
            "toy": "300",
            "color": "639ACE"
          }
        ]
      }
    ]
    ...
  }
}
 
In the code above, we have set the annotation type to line, specified the starting x and y co-ordinates and the ending x and y co-ordinates and also a color for the line.
 
Setting the thickness of the line
 
The thickness of the line can be defined using the thickness attribute. thickness='5' will give:
 
 
Dashed line
 
The line can be made dashed by setting dashed='1'.
 
 
The dash properties - dash length & gap can be customized using the dashLen and dashGap attributes. Setting dashLen='1' and dashGap='4', we will have:
 
 
The final XML/JSON for the above line will be:
 
<chart>
         ...
         <annotations>
            <annotationGroup id='Grp1' >
               <annotation type='line' x='200' y='200' toX='300' toY='300' color='639ACE' dashed='1' dashLen='1' dashGap='4'/>
            </annotationGroup>
         </annotations>
         ...
</chart>
{
  "chart": {},
  ...
  "annotations": {
    "groups": [
      {
        "id": "Grp1",
        "items": [
          {
            "type": "line",
            "x": "200",
            "y": "200",
            "tox": "300",
            "toy": "300",
            "color": "639ACE",
            "dashed": "1",
            "dashlen": "1",
            "dashgap": "4"
          }
        ]
      }
    ]
    ...
  }
}
 
The various attributes using which the line annotation can be customized are:
 
Attribute Name Type / Range Description
type Rectangle, Circle, Polygon, Line, Arc, Text, Image The type of the annotation you wish to draw on the chart. Needs to be set to Line to create a Line annotation.
x Number The starting x co-ordinate for the annotation. This x co-ordinate is relative to the x co-ordinate of the annotation group in which the annotation is placed. For example, if you have set the x co-ordinate of the annotation group as 50 and the x co-ordinate of the annotation is 100, then the effective x co-ordinate of the annotation will be 150, w.r.t to the starting position of the chart.
y Number The starting y co-ordinate for the annotation. This again is relative to the starting y co-ordinate of the annotation group in which the annotation is placed.
toX Number The ending x co-ordinate for the line. This co-ordinate is relative to the starting x-position of the annotation group in which the annotation is placed.
toY Number The ending y co-ordinate for the line. This co-ordinate is relative to the starting y-position of the annotation group in which the annotation is placed.
color Hex Color (without the '#') A generic color for the annotation from which font color, fill color and border color (whichever applies) will be derived automatically.
alpha Number(1-100) The alpha (transparency) of the annotation. By default, it will be set to 100.
thickness Number The thickness of the line.
     
Dash properties
dashed Boolean (0 or 1) Whether the line will be dashed or not.
dashLen Number The length of the dash in the line.
dashGap Number The gap between 2 dashes in a line.
 
Application
 
 
The XML/JSON for the above is:
 
<chart ... >
     ...
     <annotations>
        <annotationGroup>
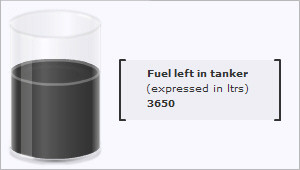
         <annotation type='rectangle' x='120' y='60' toX='280' toY='120' radius='0' fillcolor='333333' 
          fillAlpha='5'/>
         <annotation type='line' x='120' y='60' toY='120' color='333333' thickness='2'/>
         <annotation type='line' x='280' y='60' toY='120' color='333333'  thickness='2'/>
         <annotation type='line' x='120' y='60' toX='125' color='333333'  thickness='2'/>
         <annotation type='line' x='120' y='120' toX='125' color='333333'  thickness='2'/>
         <annotation type='line' x='275' y='60' toX='280' color='333333'  thickness='2'/>
         <annotation type='line' x='275' y='120' toX='280' color='333333'  thickness='2'/>
         <annotation type='text' label='Fuel left in tanker' font='Verdana' x='145' y='65' align='left' vAlign='left' 
          fontcolor='333333' fontSize='10' isBold='1'/>
         <annotation type='text' label='(expressed in ltrs)' font='Verdana' x='144' y='80' align='left' vAlign='left' 
          fontcolor='333333' fontSize='10'/>
         <annotation type='text' label='3650' font='Verdana' x='145' y='95' align='left' vAlign='left'
          fontcolor='333333' fontSize='10' isbold='1'/>
       </annotationGroup>
     </annotations>
  </chart>
{
  "chart": {...},
  ...
  "annotations": {
    "groups": [
      {
        "items": [
          {
            "type": "rectangle",
            "x": "120",
            "y": "60",
            "tox": "280",
            "toy": "120",
            "radius": "0",
            "fillcolor": "333333",
            "fillalpha": "5"
          },
          {
            "type": "line",
            "x": "120",
            "y": "60",
            "toy": "120",
            "color": "333333",
            "thickness": "2"
          },
          {
            "type": "line",
            "x": "280",
            "y": "60",
            "toy": "120",
            "color": "333333",
            "thickness": "2"
          },
          {
            "type": "line",
            "x": "120",
            "y": "60",
            "tox": "125",
            "color": "333333",
            "thickness": "2"
          },
          {
            "type": "line",
            "x": "120",
            "y": "120",
            "tox": "125",
            "color": "333333",
            "thickness": "2"
          },
          {
            "type": "line",
            "x": "275",
            "y": "60",
            "tox": "280",
            "color": "333333",
            "thickness": "2"
          },
          {
            "type": "line",
            "x": "275",
            "y": "120",
            "tox": "280",
            "color": "333333",
            "thickness": "2"
          },
          {
            "type": "text",
            "label": "Fuel left in tanker",
            "font": "Verdana",
            "x": "145",
            "y": "65",
            "align": "left",
            "valign": "left",
            "fontcolor": "333333",
            "fontsize": "10",
            "isbold": "1"
          },
          {
            "type": "text",
            "label": "(expressed in ltrs)",
            "font": "Verdana",
            "x": "144",
            "y": "80",
            "align": "left",
            "valign": "left",
            "fontcolor": "333333",
            "fontsize": "10"
          },
          {
            "type": "text",
            "label": "3650",
            "font": "Verdana",
            "x": "145",
            "y": "95",
            "align": "left",
            "valign": "left",
            "fontcolor": "333333",
            "fontsize": "10",
            "isbold": "1"
          }
        ]
      }
    ]
  }
}