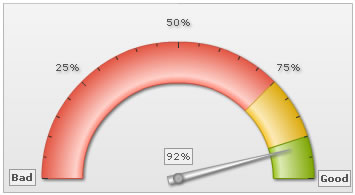
The angular gauge can effectively use Styles feature to apply animation, effects and font styling to each and every object on the chart.
Shown below is a simple example where we've applied font style to limit and value textboxes and shadow style to tick values:
<chart lowerLimit="0" upperLimit="100" lowerLimitDisplay="Bad" upperLimitDisplay="Good" gaugeStartAngle="180" gaugeEndAngle="0" palette="1" numberSuffix="%" tickValueDistance="20" showValue="1">
  <colorRange>
    <color minValue="0" maxValue="75" code="FF654F"/>
    <color minValue="75" maxValue="90" code="F6BD0F"/>
    <color minValue="90" maxValue="100" code="8BBA00"/>
  </colorRange>
  <dials>
    <dial value="92" rearExtension="10"/>
  </dials>
  <styles>
    <definition>
      <style type="font" name="myValueFont" bgColor="F1f1f1" borderColor="999999"/>
      <style type="font" name="limitsFont" bold="1" bgColor="F1f1f1" borderColor="999999"/>
      <style type="shadow" name="myShadow"/>
    </definition>
    <application>
      <apply toObject="Value" styles="myValueFont"/>
      <apply toObject="Limitvalues" styles="limitsFont"/>
      <apply toObject="tickvalues" styles="myShadow"/>
    </application>
  </styles>
</chart>
{
  "chart": {
    "lowerlimit": "0",
    "upperlimit": "100",
    "lowerlimitdisplay": "Bad",
    "upperlimitdisplay": "Good",
    "gaugestartangle": "180",
    "gaugeendangle": "0",
    "palette": "1",
    "numbersuffix": "%",
    "tickvaluedistance": "20",
    "showvalue": "1"
  },
  "colorrange": {
    "color": [
      {
        "minvalue": "0",
        "maxvalue": "75",
        "code": "FF654F"
      },
      {
        "minvalue": "75",
        "maxvalue": "90",
        "code": "F6BD0F"
      },
      {
        "minvalue": "90",
        "maxvalue": "100",
        "code": "8BBA00"
      }
    ]
  },
  "dials": {
    "dial": [
      {
        "value": "92",
        "rearextension": "10"
      }
    ]
  },
  "styles": {
    "definition": [
      {
        "type": "font",
        "name": "myValueFont",
        "bgcolor": "F1f1f1",
        "bordercolor": "999999"
      },
      {
        "type": "font",
        "name": "limitsFont",
        "bold": "1",
        "bgcolor": "F1f1f1",
        "bordercolor": "999999"
      },
      {
        "type": "shadow",
        "name": "myShadow"
      }
    ],
    "application": [
      {
        "toobject": "Value",
        "styles": "myValueFont"
      },
      {
        "toobject": "Limitvalues",
        "styles": "limitsFont"
      },
      {
        "toobject": "tickvalues",
        "styles": "myShadow"
      }
    ]
  }
}
| Object Name | Description | Features supported | Animation Parameters |
| BACKGROUND | Background refers to the background for entire chart. |
|
|
| DIAL | All the dials on the gauge. |
|
|
| GAUGE | The color range (qualitative range) for the chart. |
|
|
| PIVOT | The base circle from which dial emanates. |
|
|
| VALUE | Value textfield for the dial (if visible). |
|
|
| TICKMARKS | Tick marks on the gauge scale. |
|
|
| TICKVALUES | Value for tick marks. |
|
|
| LIMITVALUES | Textfield representing chart lower and upper limit. |
|
|
| TRENDPOINTS | All defined trend points for the chart. |
|
|
| TRENDVALUES | Value of defined trend lines. |
|
|
| TRENDMARKERS | Trend-markers, if any. |
|
|
| TOOLTIP | Tooltip for the chart. |
|