FusionCharts for Flex > Quick Chart Configuration > Chart Canvas
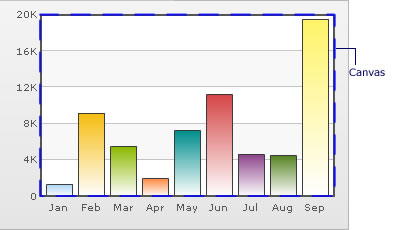
Canvas refers to the area in which the chart is plotted.
Changing Canvas Fill Color
You can fill the canvas with solid or gradient color. The following attributes let you fill a solid color in the canvas:
| Attribute | Description | Example |
|---|---|---|
| canvasbgColor | Lets you set the background color for the Canvas. Use hex color code without #. To use a gradient fill, specify all the colors of the gradient separated by commas. | canvasbgColor='1D8BD1' |
| canvasbgAlpha | Lets you sets alpha (transparency) for canvas. | canvasbgAlpha='60' |
Example:
<chart ... canvasBgColor='CCCCCC' canvasBgAlpha='80' ...>
Customizing Canvas Border
2D Charts have a border around the canvas as shown below:
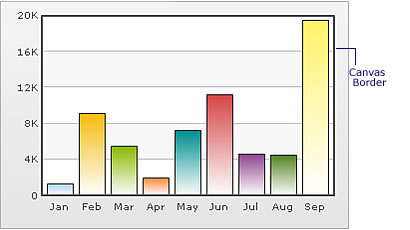
You can customize the canvas border using the attributes discussed below:
| Attribute | Description | Example |
|---|---|---|
| canvasBorderColor | Lets you set the color of the canvas border. | canvasBorderColor='1D8BD1' |
| canvasBorderThickness | Lets you set thickness of the canvas border (in pixels) | canvasBorderThickness='2' |
| canvasBorderAlpha | Lets you set alpha of the canvas border. | canvasBorderAlpha='60' |
Example:
<chart ... canvasBorderColor='666666' canvasBorderThickness='1'
canvasBorderAlpha='80' ...>Using gradient fills for canvas
Following attributes help you define a gradient fill for the canvas:
| Attribute | Description | Example |
|---|---|---|
| canvasBgColor | In order to use a gradient fill for the canvas you need to define two (or more) colors separated by comma. Use hex code without specifying #. | canvasBgColor='1D8BD1,FFFFFF' |
| canvasBgAlpha | For each color code that you've specified in canvasbgColor attribute, you need to specify a respective alpha (transparency). Separate the alphas by comma. | canvasBgAlpha='40,100' |
| canvasBgRatio | Ratio of each color that forms the gradient on a scale of 100. The value specified for each attribute should sum up to 100. For example, if you want to create an equidistant gradient of 2 colors, specify canvasbgRatio as "0,100". | canvasBgRatio='40,60' |
| canvasBgAngle | Angle of the gradient fill (in degrees - 0-360). | canvasBgAngle='270' |
Example:
<chart canvasBgColor='FFFFFF,FF5904' canvasBgAlpha='100,40' canvasBgRatio='0,100' canvasBgAngle='180'>
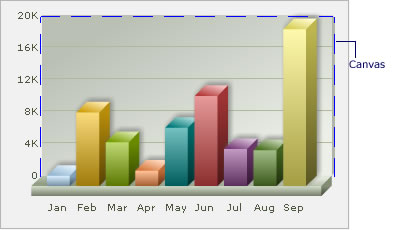
Configuration Options for 3D Canvas
Following attributes will help you configure the canvas of a 3D chart:
| Attribute | Description | Example |
|---|---|---|
| showCanvasBg | Whether or not to show canvas background. | showCanvasBg='1' |
| showCanvasBase | Whether or not to show canvas base. | showCanvasBase='1' |
| canvasBaseDepth | Height of canvas base (in pixels) | canvasBaseDepth='10' |
| canvasBgDepth | Depth of Canvas Background | canvasBgDepth='3' |
Applying effects to Canvas
Using STYLES, you can apply effects like bevel, shadow, glow, and blur to canvas. Shown below is an example where bevel (right side only) and shadow have been applied to canvas.
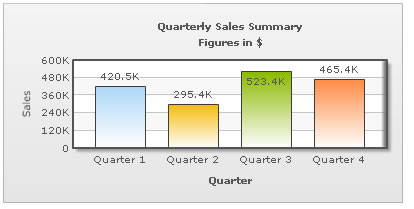
The XML for the above chart is stated below:
<chart caption='Quarterly Sales Summary' subcaption='Figures in $' xAxisName='Quarter' yAxisName='Sales'>
    <set label='Quarter 1' value='420500' />
    <set label='Quarter 2' value='295400' />
    <set label='Quarter 3' value='523400' />
    <set label='Quarter 4' value='465400' />
    <styles>
        <definition>
            <style name='myBevel' type='Bevel' angle='0' />
            <style name='myShadow' type='Shadow' distance='5' angle='45'/>
        </definition>
        <application>
            <apply toObject='Canvas' styles='myBevel,myShadow' />
        </application>
    </styles>
</chart>
You can similarly apply other effects too.
Animating the Canvas
Using STYLES, you can also animate the chart canvas. The XML below applies a grow-effect to the 2D canvas. For 3D canvas, you can animate only _alpha property.
<chart caption='Quarterly Sales Summary' subcaption='Figures in $' xAxisName='Quarter' yAxisName='Sales'>
    <set label='Quarter 1' value='420500' />
    <set label='Quarter 2' value='295400' />
    <set label='Quarter 3' value='523400' />
    <set label='Quarter 4' value='465400' />
    <styles>
        <definition>
            <style name='myCanvasAnimX' type='Animation' param='_xScale' start='0' duration='1' />
            <style name='myCanvasAnimY' type='Animation' param='_yScale' start='0' duration='1' />
        </definition>
        <application>
            <apply toObject='Canvas' styles='myCanvasAnimX,myCanvasAnimY' />
        </application>
    </styles>
</chart>
In a similar manner, you can apply other animation effects to 2D canvas.