FusionCharts for Flex > Your First Chart > Specifying Width and Height
The default width and height are 400 pixels and 300 pixels respectively. You can always manipulate the dimension of a chart by various methods. You can change the size of the chart either in the Design view by dragging its borders or by specifying the height and width through the Property Window. You can even change the height and the width directly by making changes in the code. Let us see how:
Specifying Height & Width
Here, we will change the height and width of the previously created sales chart. We will change the width to 500 and height to 250. The following code contains the changes in bold.
<?xml version="1.0" encoding="utf-8"?>
<s:Application xmlns:fx="http://ns.adobe.com/mxml/2009"
			   xmlns:s="library://ns.adobe.com/flex/spark"
			   xmlns:mx="library://ns.adobe.com/flex/mx" xmlns:components="com.fusioncharts.components.*">

	<components:FusionCharts x="10" y="10" width="500" height="250" FCChartType="Column3D" FCDataURL="Data.xml"/>


</s:Application>
In the above code, we have set the width and height of the chart to 500 pixels and 250 pixels respectively. When you set the height and width by dragging the borders of the chart in the Design view, you'll find that the respective adjustments are automatically applied to the code too.
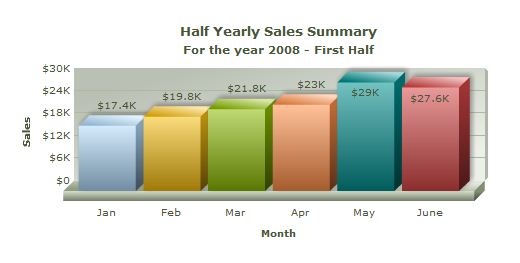
The image below shows how the previously created sales chart look with the newly set dimension.
Specifying Height & Width in Percentage
Apart from setting height and width in absolute values in pixels, we can also specify height and width values in percentage. The percentage refers to the percentage of the width and height of the parent container. We extend our previous case by putting the chart in a panel container and then make it occupy the whole of the container. In the Design view, we can drag a panel container and then pull the FusionCharts object within it. We'll set the height and width of the panel to 500 pixels and 400 pixels respectively and set the height and width of the chart to 100%.
<?xml version="1.0" encoding="utf-8"?>
<s:Application xmlns:fx="http://ns.adobe.com/mxml/2009"
	xmlns:s="library://ns.adobe.com/flex/spark"
	xmlns:mx="library://ns.adobe.com/flex/mx" xmlns:components="com.fusioncharts.components.*">

	<s:Panel x="10" y="10" width="500" height="400">
		<components:FusionCharts x="10" y="10" width="100%" height="100%" FCChartType="Column3D"
			FCDataURL="Data.xml"/>
	</s:Panel>

</s:Application>
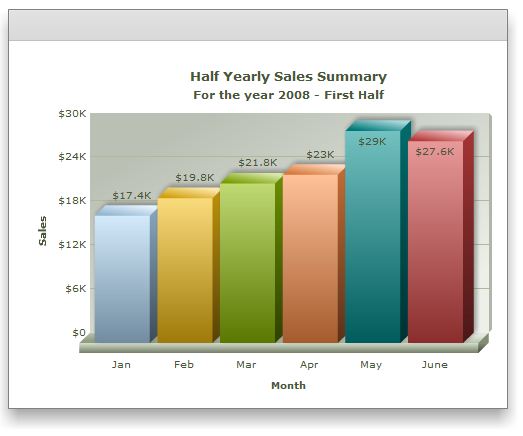
The following chart will be rendered upon execution of the code:
A chart with dimensions set in percentage can dynamically scale and fit itself to the available space. Hence, if you create the chart in a container that can change dimensions based on conditions like available space or user interactivity, the chat will automatically resize the changed size of the container.