The linear gauge is a real time chart, which can continuously request new data from the server and display the same, without involving any page refreshes. You can specify the URL of the data provider and the time interval (in seconds), after which the gauge will look for new data.
The data provider page needs to be a page at your server side, which when invoked by linear gauge would output the new data in the format explained below.
The real-time data format for linear gauge depends on:
- Whether you've multiple pointers on the chart or a single pointer?
- If you've multiple pointers, whether you want to provide data by pointer numerical index or by their defined IDs?
- Whether you're using Message Logger for the chart?
- Commands for the chart - like stop update
Let's quickly see examples of each one of them.
In the simplest form, if you're looking to update the value of a gauge, you need to output the data in following format:
&value=34
Here, we're just outputting a single value 34. So, when FusionWidgets would read this value, it would update the chart by setting its value to 34 (if the data is within range).
If you've multiple pointers defined, you can update them all in a single update by outputting the following from real-time data provider page:
&value=34|25|54
Here, we're specifying three values in the real-time update. So, assuming that we've 3 pointers or pointers defined in the chart, each one of them will take the sequential value and update itself. That is, the first pointer would now display 34, second one would display 25 and the third one 54. The sequence of pointer is determined by its order in XML data document.
FusionWidgets also allows you define the ID for each pointer as under:
In linear gauge:
<pointer id='CPU1Temp' ..../>
<pointer id='CPU2Temp' ..../>
You can now update each of these named pointer by outputting the following in your real-time data stream:
&CPU1Temp=23&CPU2Temp=34
This will change the value of pointer 1 (with id as CPU1Temp) to 23 and pointer 2 to 34.
If you wish to stop the chart from polling the server for any more real-time updates, send the following command from server to perform the task:
&stopUpdate=1
After stopping the update, it can be restarted either using user interaction (right click context menu) or using client side JavaScript.
To create any real-time gauge, you'll need to assimilate the following things:
- Chart SWF file
- XML file that initializes the chart and tells it where to pull the real time data from
- Real time data provider page that provides updated data to chart in real-time data format.
We're already familiar with XML for the chart. The new attributes that need to be added for real-time update are as follows:
| Attribute Name | Type / Range | Description |
| dataStreamURL | URL | This parameter sets the path of the page which is supposed to relay real-time data to the chart. If you've special characters as a part of your data stream URL, like ? or &, you'll need to URL Encode the entire dataStreamURL This page needs to be on the same sub-domain on which the chart is hosted and invoked from. Otherwise, the Flash sandbox security would restrict it from accessing the data and hence the real-time feature won't work. Example: dataStreamURL='liveQuote.aspx?name=xyz' |
| refreshInterval | Number | For this parameter, you can specify the number of seconds after which the chart will look for new data. This process will happen continuously - i.e., if you specify 5 seconds here, the chart will look for new data every 5 seconds. |
| dataStamp | String | Constantly changing data stamp that can be added to real time data URL, so as to maintain a state. Please see the section "Real time capabilities > Adding data-stamp" |
Shown below is an example chart XML:
<chart lowerLimit='0' upperLimit='100' lowerLimitDisplay='Bad' upperLimitDisplay='Good' palette='1' numberSuffix='%' chartRightMargin='20' decimals='0' dataStreamURL='CPUData.asp' refreshInterval='3'>
<colorRange>
<color minValue='0' maxValue='75' code='FF654F' label='Bad'/>
<color minValue='75' maxValue='90' code='F6BD0F' label='Moderate'/>
<color minValue='90' maxValue='100' code='8BBA00' label='Good'/>
</colorRange>
<pointers>
<pointer id='CPU1' value='92' toolText='CPU 1 Usage'/>
<pointer id='CPU2' value='43' toolText='CPU 2 Usage'/>
</pointers>
<styles>
<definition>
<style type='font' name='myValueFont' bgColor='F1f1f1' borderColor='999999' />
</definition>
<application>
<apply toObject='Value' styles='myValueFont' />
</application>
</styles>
</chart>
Here, we've set dataStreamURL='CPUData.asp' refreshInterval='3', which tells the chart to poll new data from CPUData.asp every 3 seconds.
For the sake of demo, CPUData.asp returns 2 random values within 100% in the format:
&value=84|14
It can also return data in the following format, as we've defined the IDs for both pointers:
&CPU1=23&CPU2=43
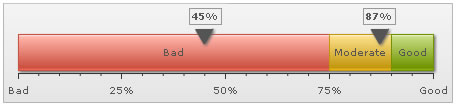
When you run this chart, you'll get an image similar to the one shown below, with both pointers updating their value in every 3 seconds:
| If the chart renders initially, but doesn't update in real time, check the following: |
|