In this method, the entire chart data (XML or JSON) is provided as a string and embedded into the same page as the chart. When a chart renders or gets updated in a page, it reads the chart data from the string and then renders the chart. The following diagram (along with the steps described below) will help you understand better:
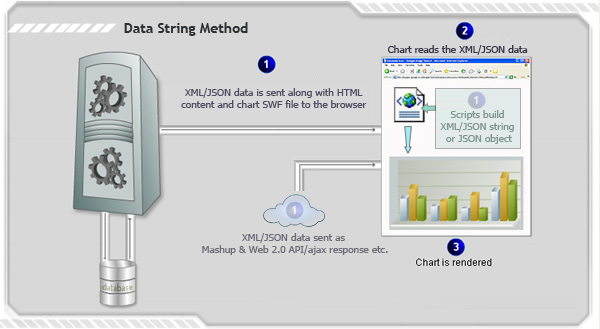
- Unlike Data URL method, here, the entire XML or JSON data is embedded as string in the web page containing the chart. The data can be embedded in various ways like:
- The data can be generated from dynamic data-sources like database etc. using server side scripts and embedded into the web page (while creating the page)
- The data can be generated in the page itself using JavaScript without external dependencies (e.g., when creating a chart from HTML Form)
- The data can be acquired using various Web API's, AJAX responses and stored as string in the page itself
- Once the chart is loaded on the end user's machine or a chart's data needs to be updated, it reads the XML/JSON string or JSON object embedded into the page using JavaScript functions
- And finally, the desired chart is rendered!
Effectively, in this process you need the following to build a chart:
- Chart Container Page - The page which contains the HTML code to embed the chart. It also contains the XML data to be used by the chart.
- Chart SWF File - SWF file for the chart that you wish to render. Each chart in FusionCharts XT is an SWF file that creates a specific type of chart. For example, if you want to create 3D column chart, you'll need the SWF file called Column3D.swf.
- FusionCharts Javascript Files - These files help in embedding the chart SWF file in your HTML page and rendering JavaScript (HTML5) fallback charts. The files are named FusionCharts.js, FusionCharts.HC.js, FusionCharts.HC.Widgets.js and jquery.min.js.
<div id="chart1div">
   This text is replaced by the chart.
</div>
<script type="text/javascript">
   var chart1 = new FusionCharts("Column2D.swf", "ChId1", "600", "400", "0", "1");
   chart1.setXMLData("<chart><set label='Data1' value='1' /></chart>");
   chart1.render("chart1div");
</script>
FusionCharts JavaScript class provides other functions to achieve the same : setJSONData, setChartData, setDataXML (deprecated)
To ease embedding of charts in your web pages, FusionCharts XT provides wrapper classes ready for various server-side scripts like ASP, ASP.NET C#, ASP.NET VB.NET, PHP, J2EE, Ruby on Rails and ColdFusion. Moreover, in ASP and PHP, the APIs allow you to connect to arrays and databases and even dynamically build XML data which can directly be provided to chart.
Here, we provide highlights of code snippets that are used in each technology to embed FusionCharts XT using Data String method.
Using ASP
Call renderChart("../../FusionCharts/Column3D.swf", "", chartDataAsString, "myFirst", 600, 300, false, false)
Read more.
Using ASP.NET C#
FusionCharts.RenderChart("../FusionCharts/Column3D.swf", "", chartDataAsString, "myFirst", "600", "300", false, false);
Read more.
Using ASP.NET VB
FusionCharts.RenderChart("../FusionCharts/Column3D.swf", "", chartDataAsString, "myFirst", "600", "300", False, False)
Read more.
Using PHP
renderChart("../../FusionCharts/Column3D.swf", "", $chartDataAsString, "myFirst", 600, 300, false, false);
Read more.
Using J2EE
<jsp:include page="../Includes/FusionChartsRenderer.jsp" flush="true">
	<jsp:param name="chartSWF" value="../../FusionCharts/Column3D.swf" />
	<jsp:param name="strURL" value="" />
	<jsp:param name="strXML" value=chartDataAsString />
	<jsp:param name="chartId" value="myFirst" />
	<jsp:param name="chartWidth" value="600" />
	<jsp:param name="chartHeight" value="300" />
	<jsp:param name="debugMode" value="false" />
	<jsp:param name="registerWithJS" value="false" />
</jsp:include>
Read more.
Using ColdFusion
<cfoutput>#renderChart("../../FusionCharts/Column3D.swf", "", chartDataAsString, "myFirst", 600, 300, false, false)#</cfoutput>
Read more.
Using Ruby on Rails
render_chart '/FusionCharts/Column3D.swf', '', chartDataAsString, 'configuredChart', 600, 300, false, false
Read more.