FusionWidgets XT uses the concept of streaming and showing real-time messages in the chart using Message Logger. The Message logger can be effectively used to show necessary real-time information or live error logs.
Essentially, the message logger is a text based scrollable window that can listen to messages streamed from server and then do one of the following:
- Display the message in the message logger window
- Pass it to custom JavaScript functions (defined by you) for further actions
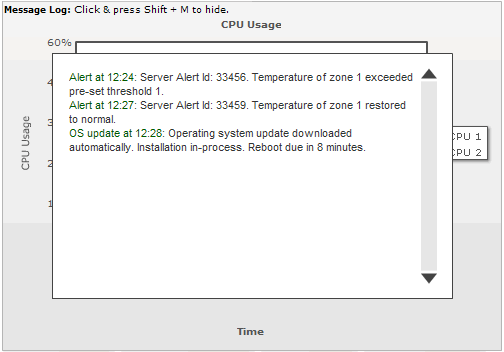
A simple message logger in a chart looks something as under:

In the above screenshot, we've a real-time line chart that is monitoring CPU usage of multiple CPUs on the same chart. Also, on the top of the chart, we've used the message logger. As you can see above, the message logger contains multiple messages that were streamed to it by the server.
The message logger in FusionWidgets XT has the following features:
- Message logger is supported in all the real-time charts & gauges. The non real-time charts do not support message logger.
- Each real time update of the chart can contain 1 message to be added to the logger.
- The message logger can contain any number of messages. It's a scrollable logger.
- The cosmetics of this message logger are fully customizable.
- Messages streamed to this message logger can either be displayed in the in-built logger or passed to any JavaScript function present in the same page. This helps you build your custom client-side loggers, without having to worry about retrieving real time data from server, as that's handled by FusionWidgets XT.
- Can be switched on or off by setting useMessageLog to 0 or 1 in the <chart> element of the XML (or in the chart Object of the JSON) for the chart.
- Additionally, your end users can also show/hide it at client side using Shift+M key combination
- You can also use client-side JavaScript to show/hide message logger for a chart.
- Messages streamed to the logger can be of 4 types - INFO, ERROR, LITERAL or LINK. You can decide the type for each message that you send to logger. Based on their type, they are displayed with different formatting in the Message Logger.
- The logger can be dynamically cleared at run-time (to get rid of existing messages) either by sending a &clearLog=1 flag in the real-time data stream, or using client-side JavaScript.
- The message logger window in JavaScript Real-time charts & gauges shows a close button that allows you to close the logger.
Let's next see how to setup the message logger for your chart.