FusionWidgets XT uses FusionCharts JavaScript Class that takes care of all the products of FusionCharts XT Suite including FusionWidgets XT.
FusionCharts JavaScript Class allows you to change various settings and properties of an existing chart. You can dynamically update chart's root properties (also known as "chart attributes" which are passed through <chart> element in chart XML data or through chart property in chart's JSON data) on-the-fly. This feature will come handy when you wish to change the chart titles, theme colors, number formatting or scaling setup, divisional line and grid configurations and other functional and cosmetic features of an existing chart. While the API allows you to update selective properties, internally, FusionCharts re-draws the entire chart.
Moreover, you can also change the chart's width and height at run-time.
All the chart attributes are listed under "<chart> element attributes" section of the XML Sheet of each chart.
You need to use the setChartAttribute() function to set a chart attribute. All you need to do is pass the name of the attribute and its new value to this function. This function is available in all instances of FusionCharts JavaScript Class. If you wish to change more than one chart attributes at one go, you can pass multiple attributes and their respective values as an Object. Each property name of the Object will take the name of the attribute. Value of each property will take the new value of the attribute.
Let's take some samples to illustrate the working of the function:
myChart.setChartAttribute( "caption" , "Latest sales report" );
In the above code, we pass the attribute name as the first parameter and the new value as the second parameter.
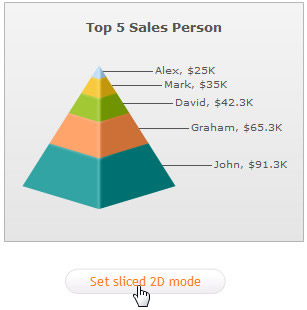
Let us create a small sample that changes the 3D Pyramid to 2D pyramid and the data items are sliced out as shown in the images below:
 |
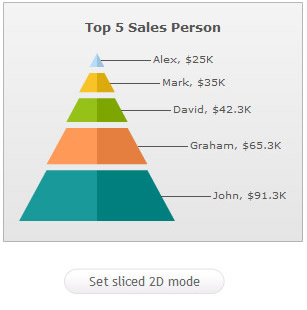 |
| The chart after rendered for the first time | Chart in 2D mode |
<html>
  <head>
    <title>Update Chart data</title>
    <script type="text/javascript" src="../../Charts/FusionCharts.js">
    </script>
  </head>
  <body>
    <center>
    <div id="chartContainer">Chart will load here!</div>
    <script type="text/javascript"><!--

      var myChart = new FusionCharts( "../../Charts/Pyramid.swf",
        "myChartId", "300", "240", "0", "1" );
      myChart.setXMLUrl("Data.xml");
      myChart.render("chartContainer");

	  function changeAttribute()
	  {
		  // get chart reference
		  var chartReference = FusionCharts( "myChartId" );

		  // change to sliced 2D view
		  chartReference.setChartAttribute( { "isSliced" : "1", "is2D" : "1" } );
	  }
    // -->
    </script>

    <input type="button" onClick="changeAttribute();" value="Set sliced 2D mode" >
    </center>
  </body>
</html>
In the above code, we have done the following:
- Created a chart
- Placed a button that calls the changeAttribute()function.
This function:
- Gets chart reference using FusionCharts("myChartId")
- Passes an object containing new attribute values using the setChartAttribute() function. The object contains two properties - isSliced and is2D.
Note: If you've to update multiple properties of the chart at once, it is recommended to use the object notation as used in the above code and pass all of them at once. This eliminates the need for multiple re-draws.
Note: In case you want to remove an attribute from the data, you can pass null as the value of the attribute. e.g., the setChartAttribute( "isSliced" , null ) will remove the isSliced attribute from the data.
Other samples
var chartReference = FusionCharts("myChartId");
chartReference.setChartAttribute({"subCaption" : "new sub-title"});
In the above code, we pass an object as the parameter.
Change number formatting settings
var chartReference = FusionCharts("myChartId");
chartReference.setChartAttribute({formatNumberScale : 1, decimals : 2, yAxisForceDecimals : 1});
var chartReference = FusionCharts("myChartId");
chartReference.setChartAttribute("showTooltip",0);
Set off shadow and lighting effects
var chartReference = FusionCharts("myChartId");
chartReference.setChartAttribute({"showShadow" : "0", "is2D" : "1"});
Listed below are the few limitations of the setChartAttribute() function:
- The setChartAttribute() works only using FusionCharts JavaScript Object reference. This function is not available if you use FusionCharts HTML Object reference.
- You can update only those attribute which are available in the <chart> element of a chart's XML data or "chart" property of a chart's JSON data.
FusionCharts JavaScript Class provides an easy function to set chart messages. For this you need to use the configure() function.
When you wish to set a chart message this function takes the message attribute name and the custom message that you wish to set. Let's take a sample as shown below:
<div id="chartContainer">Chart will load here</div>
<script type="text/javascript"><!--
  var myChart = new FusionCharts("Pyramid.swf", "myChartId", "300", "250", "0", "1");
  myChart.setXMLUrl("<chart></chart>");
  myChart.configure("ChartNoDataText", "Please select a record above");
  myChart.render("chartContainer");
// --></script>
The line myChart.configure("ChartNoDataText", "Please select a record above") sets a custom chart message when the chart does not find any data to plot.
There are advanced ways to use the configure() function while setting the chart messages. For details read Advanced Charting > Changing Chart Messages page.
FusionCharts JavaScript Class allows you to resize an existing chart using the resizeTo() function. You can pass the new width and height of the chart in pixels or percent parameters of resizeTo() function. You can also change width and height property of the chart object and then call the resizeTo() function. The code samples below shows how you can do this:
Please note that resizeTo()function, width and height properties only work using FusionCharts JavaScript object. It is not available in FusionCharts HTML Object.
Resize chart using pixel values
var chartReference = FusionCharts( "myChartId" );
chartReference.resizeTo( "500", "350" );
Resize chart using percent values
var chartReference = FusionCharts( "myChartId" );
chartReference.resizeTo( "80%", "75%" );
Resize chart setting width and height properties
var chartReference = FusionCharts( "myChartId" );
chartReference.width = "500";
chartReference.height = "80%";
chartReference.resizeTo();
Code examples discussed in this section are present in Download Package > Code > JavaScript > Basics folder.