You are viewing documentation for an older version. For current documentation - click here.

Let us take a look at the Text Annotation here. The Text annotation looks like just any other text on the chart - just that you can place any number of text annotations anywhere on the chart. A text annotation will look as under:

 
The XML/JSON to create the above is:
 
<chart>
         ...
         <annotations>
            <annotationGroup id='Grp1' >
               <annotation type='text' x='200' y='200' label='Text' />
            </annotationGroup>
         </annotations>
         ...
</chart>
{
  "chart": {},
  ...
  "annotations": {
    "groups": [
      {
        "id": "Grp1",
        "items": [
          {
            "type": "text",
            "x": "200",
            "y": "200",
            "label": "Text"
          }
        ]
      }
    ]
    ...
  }
}
 
As it is very clear from the code above, we need to set the annotation type to text, specify the x and y co-ordinates where we want the text to be placed and finally, the label of the text annotation - what we want to display in the text annotation.
 
Customizing font face, size & color
 
The font face, size & color can be customized using the font, fontSize and fontColor attributes. font='Arial', fontSize='15', fontColor='639ACE' will give us:
 
 
Formatting the text
 
Various kinds of formatting can be applied to the text - bold, italics, underline. The text can be made bold, italicized and underlined by using the bold, italic and underline attributes and setting the required ones to 1.
 
 
Multi-line text
 
Text can be made multi-line by separating the lines by {br}. The {br} is a pseudo code and is equivalent to <br> HTML tag. For example, label='Line 1 text{br}Line 2' will yield:
 
 
Wrapping text
 
Text can be wrapped by setting wrap='1' and then defining either a wrap width or height or both, exceeding which the text will be wrapped. Suppose we have a text label 'Text Annotation Label'. We set wrap='1' and set a wrap width of 40 for it by setting wrapWidth='40'. So the width of the textbox in which this text is placed will be 40 and the remaining text will be wrapped to the next line.
 
 
Adding a background fill and border
 
A background fill can be added to the text using the bgColor attribute. A border can be added using the borderColor attribute. As an example, we will set bgColor='E1F5FF' and borderColor='639ACE'.
 
 
Aligning text
 
The text can be horizontally aligned (left, center or right) using the align attribute and vertically aligned (top, middle or bottom) using the vAlign attribute. It is especially useful for text spanning multiple lines.
 
 
The various attributes using which the text annotation can be customized are:
 
Attribute Name Type / Range Description
type Rectangle, Circle, Polygon, Line, Arc, Text, Image Needs to be set to Text to create a text annotation type.
x Number The starting x co-ordinate for the annotation. This x co-ordinate is relative to the x co-ordinate of the annotation group in which the annotation is placed. For example, if you have set the x co-ordinate of the annotation group as 50 and the x co-ordinate of the annotation is 100, then the effective x co-ordinate of the annotation will be 150, w.r.t to the starting position of the chart.
y Number The starting y co-ordinate for the annotation. This again is relative to the starting y co-ordinate of the annotation group in which the annotation is placed.
color Hex Color (without the '#') A generic color for the annotation from which fill color and border color (whichever applies) will be derived automatically.
label String Herein, you specify the text that you want to display using the text annotation.
align left/center/right This attribute sets the horizontal alignment of the text.
Default value: center.
vAlign top/middle/bottom This attribute sets the vertical alignment of the text.
Default value: middle.
font Font Face This attribute sets the font name in which you want the text label to be displayed in.
Default Value: Verdana
fontSize Number This attribute sets the font size of the text label.
Default value: 10
fontColor Hex code (without the '#') This attribute sets the font color of the text label. By default, the value is the same as defined by the generic color attribute.
bold Boolean (0 or 1) Whether the text will be bold or not.
italic Boolean (0 or 1) Whether the text will be italicized or not.
underline Boolean (0 or 1) Whether the text will be underlined or not.
letterSpacing Number The letter spacing for the text.
Default value: 0.
leftMargin Number The margin to the left of the text.
bgColor Hex code (without the '#') The background color of the box in which the text is placed.
borderColor Hex code (without the '#') The border color of the text box.
wrap Boolean (0 or 1) This attribute lets you define whether you want the text to be wrapped or not to the next line.
wrapWidth Number The maximum width after occupying which, the remaining text(if any) will be wrapped to the next line.
wrapHeight Number The maximum possible height you need for the textbox if you have set wrapping on.
 
Application
 
 
The XML/JSON for the above is:
 
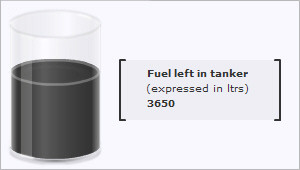
<chart manageResize="1" bgColor="F1F1FD" lowerLimit="0" upperLimit="5000" showTickMarks="0" numberSuffix=" Ltrs" tickValueDistance="20" decimals="0" tickMarkDecimals="0" cylFillColor="996633" cylRadius="45" showValue="0">
	<value>3000</value>
	<annotations>
		<annotationGroup>
			<annotation type='rectangle' x='120' y='60' toX='280' toY='120' radius='0' fillcolor='333333' fillAlpha='5'/>
			<annotation type='line' x='120' y='60' toY='120' color='333333' thickness='2'/>
			<annotation type='line' x='280' y='60' toY='120' color='333333'  thickness='2'/>
			<annotation type='line' x='120' y='60' toX='125' color='333333'  thickness='2'/>
			<annotation type='line' x='120' y='120' toX='125' color='333333'  thickness='2'/>
			<annotation type='line' x='275' y='60' toX='280' color='333333'  thickness='2'/>
			<annotation type='line' x='275' y='120' toX='280' color='333333'  thickness='2'/>
			<annotation type='text' label='Fuel left in tanker' font='Verdana' x='145' y='75' align='left' fontcolor='333333' fontSize='10' bold='1'/>
			<annotation type='text' label='(expressed in ltrs)' font='Verdana' x='144' y='90' align='left' fontcolor='333333' fontSize='10'/>
			<annotation type='text' label='3650' font='Verdana' x='145' y='105' align='left' fontcolor='333333' fontSize='10' bold='1'/>
		</annotationGroup>
	</annotations>
</chart>
{
  "chart": {
    "manageresize": "1",
    "bgcolor": "F1F1FD",
    "lowerlimit": "0",
    "upperlimit": "5000",
    "showtickmarks": "0",
    "numbersuffix": " Ltrs",
    "tickvaluedistance": "20",
    "decimals": "0",
    "tickmarkdecimals": "0",
    "cylfillcolor": "996633",
    "cylradius": "45",
    "showvalue": "0"
  },
  "value": "3000",
  "annotations": {
    "groups": [
      {
        "items": [
          {
            "type": "rectangle",
            "x": "120",
            "y": "60",
            "tox": "280",
            "toy": "120",
            "radius": "0",
            "fillcolor": "333333",
            "fillalpha": "5"
          },
          {
            "type": "line",
            "x": "120",
            "y": "60",
            "toy": "120",
            "color": "333333",
            "thickness": "2"
          },
          {
            "type": "line",
            "x": "280",
            "y": "60",
            "toy": "120",
            "color": "333333",
            "thickness": "2"
          },
          {
            "type": "line",
            "x": "120",
            "y": "60",
            "tox": "125",
            "color": "333333",
            "thickness": "2"
          },
          {
            "type": "line",
            "x": "120",
            "y": "120",
            "tox": "125",
            "color": "333333",
            "thickness": "2"
          },
          {
            "type": "line",
            "x": "275",
            "y": "60",
            "tox": "280",
            "color": "333333",
            "thickness": "2"
          },
          {
            "type": "line",
            "x": "275",
            "y": "120",
            "tox": "280",
            "color": "333333",
            "thickness": "2"
          },
          {
            "type": "text",
            "label": "Fuel left in tanker",
            "font": "Verdana",
            "x": "145",
            "y": "75",
            "align": "left",
            "fontcolor": "333333",
            "fontsize": "10",
            "bold": "1"
          },
          {
            "type": "text",
            "label": "(expressed in ltrs)",
            "font": "Verdana",
            "x": "144",
            "y": "90",
            "align": "left",
            "fontcolor": "333333",
            "fontsize": "10"
          },
          {
            "type": "text",
            "label": "3650",
            "font": "Verdana",
            "x": "145",
            "y": "105",
            "align": "left",
            "fontcolor": "333333",
            "fontsize": "10",
            "bold": "1"
          }
        ]
      }
    ]
  }
}