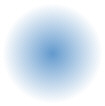
Here we will have a look at the Circle Annotation. A circle annotation looks as under:

<chart>
         ...
         <annotations>
            <annotationGroup id='Grp1'  x='200' y='200' >
               <annotation type='circle' color='639ACE' radius='50'/>
            </annotationGroup>
         </annotations>
         ...
</chart>
{
  "chart": {},
  ...
  "annotations": {
    "groups": [
      {
        "id": "Grp1",
        "x": "200",
        "y": "200",
        "items": [
          {
            "type": "circle",
            "color": "639ACE",
            "radius": "50"
          }
        ]
      }
    ]
    ...
  }
}
<chart>
...
<annotations>
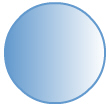
<annotationGroup id='Grp1' x='200' y='200' >
<annotation type='circle' color='639ACE,FFFFFF' radius='50'/>
</annotationGroup>
</annotations>
...
</chart>
{
  "chart": {},
  ...
  "annotations": {
    "groups": [
      {
        "id": "Grp1",
        "x": "200",
        "y": "200",
        "items": [
          {
            "type": "circle",
            "color": "639ACE,FFFFFF",
            "radius": "50"
          }
        ]
      }
    ]
    ...
  }
}


<chart>
...
<annotations>
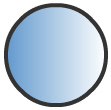
<annotationGroup id='Grp1' x='200' y='200' >
<annotation type='circle' color='639ACE,FFFFFF' radius='50' fillPattern='linear' showBorder='1'
borderColor='333333' borderThickness='4'/>
</annotationGroup>
</annotations>
...
</chart>
{
  "chart": {},
  ...
  "annotations": {
    "groups": [
      {
        "id": "Grp1",
        "x": "200",
        "y": "200",
        "items": [
          {
            "type": "circle",
            "color": "639ACE,FFFFFF",
            "radius": "50",
            "fillpattern": "linear",
            "showborder": "1",
            "bordercolor": "333333",
            "borderthickness": "4"
          }
        ]
      }
    ]
...
  }
}
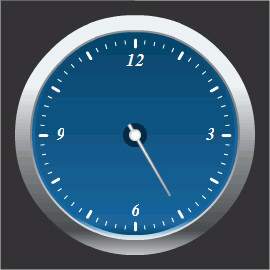
<chart ... manageResize='1' origW='270' origH='270'>
         ...
   <annotations>
      <!--Circles behind the gauge-->
       <annotationGroup id='Grp1' showBelow='1' x='135' y='135' >
         <annotation type='circle' color='EBF0F4,85898C,484C4F,C5C6C8' fillRatio='30,30,30,10'
          fillAngle='270' radius='120' fillPattern='linear' />
         <annotation type='circle' color='8E8E8E,83878A,E7E7E7' fillAngle='270' radius='105'
          fillPattern='linear' />
         <annotation type='circle' color='07476D,19669E,186AA6,D2EAF6' fillRatio='5,45,40,10' fillAngle='270'
          radius='103' fillPattern='linear' />
         <annotation type='circle' color='07476D,19669E,07476D' fillRatio='5,90,5' fillAngle='270'
          radius='100' fillPattern='linear' />
       </annotationGroup>
      <!--Circle behind the pivot-->
        <annotationGroup id='Grp2' showBelow='1' x='135' y='135' >
           <annotation type='circle' radius='12' color='012A46' />
        </annotationGroup>
     </annotations>
     ...
  </chart>
{
  "chart": {... "manageResize": "1", "origW": "270", "origH": "270" ...},
  ...
  /* Circles behind the gauge */
  "annotations": {
    "groups": [
      {
        "id": "Grp1",
        "showbelow": "1",
        "x": "135",
        "y": "135",
        "items": [
          {
            "type": "circle",
            "color": "EBF0F4,85898C,484C4F,C5C6C8",
            "fillratio": "30,30,30,10",
            "fillangle": "270",
            "radius": "120",
            "fillpattern": "linear"
          },
          {
            "type": "circle",
            "color": "8E8E8E,83878A,E7E7E7",
            "fillangle": "270",
            "radius": "105",
            "fillpattern": "linear"
          },
          {
            "type": "circle",
            "color": "07476D,19669E,186AA6,D2EAF6",
            "fillratio": "5,45,40,10",
            "fillangle": "270",
            "radius": "103",
            "fillpattern": "linear"
          },
          {
            "type": "circle",
            "color": "07476D,19669E,07476D",
            "fillratio": "5,90,5",
            "fillangle": "270",
            "radius": "100",
            "fillpattern": "linear"
          }
        ]
      },
      /* Circle behind the pivot */
      {
        "id": "Grp2",
        "showbelow": "1",
        "x": "135",
        "y": "135",
        "items": [
          {
            "type": "circle",
            "radius": "12",
            "color": "012A46"
          }
        ]
      }
    ]
...
  }
}