As you already know, using the font style type, you can control the visual properties of all the text on the chart. The following properties are extended by the font type.
See it live!
Detailed explanations with code samples follow:
| Attribute | Brief Description | Sample or Valid values |
| font | Sets the font family for the text. | Verdana, Arial .. |
| size | Specifies the font size | 10, 12 .. |
| color | Sets the font color, should be hex color code without # | FF0000, FFFFDD |
| align | Sets the alignment of the chart caption or sub-caption. This attribute is only applicable to chart captions and sub captions. The default value is center | left, right, center |
| bold | Flag indicating whether font should be bold or not | 1 for Yes, 0 for No |
| italic | Flag indicating whether font should be italics or not | 1 for Yes, 0 for No |
| underline | Flag indicating whether font should be underlined | 1 for Yes, 0 for No |
| bgColor | Sets the background color for a text box, should be hex color code without # | FF0000, FFFFDD |
| borderColor | If you need a border around your text, you can use this parameter | |
| isHTML | Helps you set whether the text should be rendered as HTML or plain text. | |
| leftMargin | The left margin of the text, in points | |
| letterSpacing | The amount of space that is uniformly distributed between characters of the text |
The basic attributes of the font are its font family, size and color which can be set using the aforementioned attributes.
Example:
| Attribute | Format | Example |
| font | font='fontfamily' | font='Verdana' |
| size | size='fontsize' | size='12' |
| color | color='HexCode (without #)' | color='FF0000' |
Here, font should refer to a font family which is present on the end users system (else the default system font would be used to draw text). Color should be in Hex code without any #. Note that color is not applicable on Trendline values.
Text align setting is only allowed in chart's caption and sub-caption Objects. You can use either "right" or "left" as alignment value. By default, the value is "center". An example can be:
And the resultant chart caption will be like the image as under:
Note: Controlling alignment of caption and sub-caption is not supported in JavaScript charts.
To decorate your text, you can use any of the above parameters as under:
| Attribute | Format | Example |
| bold | bold='Logicalvalue' | bold='1' or bold='0' |
| italic | italic='Logicalvalue' | italic='1' italic='0' |
| underline | underline='Logicalvalue' | underline='1' or underline='0' |
The above code will make sure that your font appears as bold, italicized and underlined.
If you intend to put a border color or a background color for your text boxes on the chart, you can use the above two parameter to define hex color code (without #) as under:
| Attribute | Format | Example |
| bgColor | bgColor='value' | bgColor='99E3BB' |
| borderColor | borderColor='value' | borderColor='E10000' |
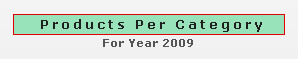
This style when applied to a text field on chart (e.g., caption), would give an output as under:
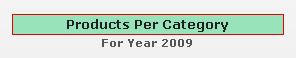 |
Chart caption ("Products Per Category") with border and background color applied to it. |
This attribute is particularly useful, when you have HTML characters as a part of your text.
| Attribute | Format | Example |
| isHTML | isHTML ='Logicalvalue' | isHTML ='1' or isHTML ='0' |
leftMargin lets you set the left margin of the text (in points) and letterSpacing allows you to control the space that is uniformly distributed between characters - the value specifies the number of pixels that are added to the space after each character. A negative value condenses the space between characters.
<style name='MyFirstFontStyle' type='font' font='Verdana' size='9' bold='1' color='1F1F1F' bgColor='99E3BB' borderColor='E10000' leftMargin='10' letterSpacing='3'/>
{
        "name":"MyFirstFontStyle",
        "type":"font",
        "font":"Verdana",
        "size":"9",
        "bold":"1",
        "color":"1F1F1F",
        "bgcolor":"99E3BB",
        "bordercolor":"E10000",
        "leftmargin":"10",
        "letterspacing":"3"
}
| Attribute | Format | Example |
| leftMargin | leftMargin='value in pixels' | leftMargin='10' |
| letterSpacing | letterSpacing='value in pixels' | letterSpacing='3' |
The above style when applied to chart caption, gives the following output: