You can access the data of the chart from its JavaScript API as well.
When using the JavaScript API to access chart data, you first need to make sure of that you are invoking the getDataAsCSV() API only after the chart has been rendered (that is, in the FC_Rendered method).
<HTML>
<HEAD>
<TITLE>PowerCharts XT and JavaScript - Getting chart data as CSV </TITLE>
<SCRIPT LANGUAGE="Javascript" SRC="../../Charts/FusionCharts.js"></SCRIPT>
<SCRIPT LANGUAGE="JavaScript">
//FC_Rendered method is called whenever a chart on the page
//has finished initial rendering. To this function, the chart passes its
//own DOM Id.
function FC_Rendered(DOMId){
//If it's our required chart
if (DOMId=="chart1Id"){
//Get reference to the chart object
var chartObj = FusionCharts("chart1Id");
//Simply alert the CSV Data
window.alert(chartObj.getDataAsCSV());
return;
}
}
</SCRIPT>
</HEAD>
<BODY>
<div id="chart1div"> FusionCharts </div>
<script language="JavaScript">
var chart1 = new FusionCharts("../../Charts/Spline.swf", "chart1Id", "400", "300", "0", "1");
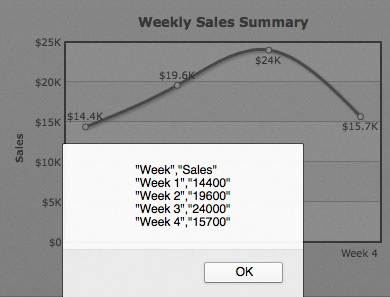
chart1.setXMLData("<chart caption="Weekly Sales Summary" xAxisName="Week" yAxisName="Sales" numberPrefix="$"><set label="Week 1" value="14400" /><set label="Week 2" value="19600" /><set label="Week 3" value="24000" /><set label="Week 4" value="15700" /></chart>");
chart1.render("chart1div");
</script>
</BODY>
</HTML>
When you run this code, you should get a screen as under:
See it live!
The customization attributes for exported CSV data still remain the same, as under (to be specified in chart XML):
| Attribute | Description | Example |
| exportDataSeparator | Lets you set the separator for CSV data. For ease of use, this attribute accepts the following pseudo codes for characters:
You can also specify any other character apart from these pseudo codes. |
exportDataSeparator='{tab}' |
| exportDataQualifier | Lets you set the qualifier character for CSV data. For ease of use, this attribute accepts the following pseudo codes for characters:
You can also specify any other character apart from these pseudo codes. |
exportDataQualifier='{quot}' |
| exportDataFormattedVal | Boolean value indicating whether to output formatted data values (as shown on chart) in the output CSV file. | exportDataFormattedVal='1' |